Free US Radio vs TV Advertising Revenue Trends from 2015 to 2025 Chart
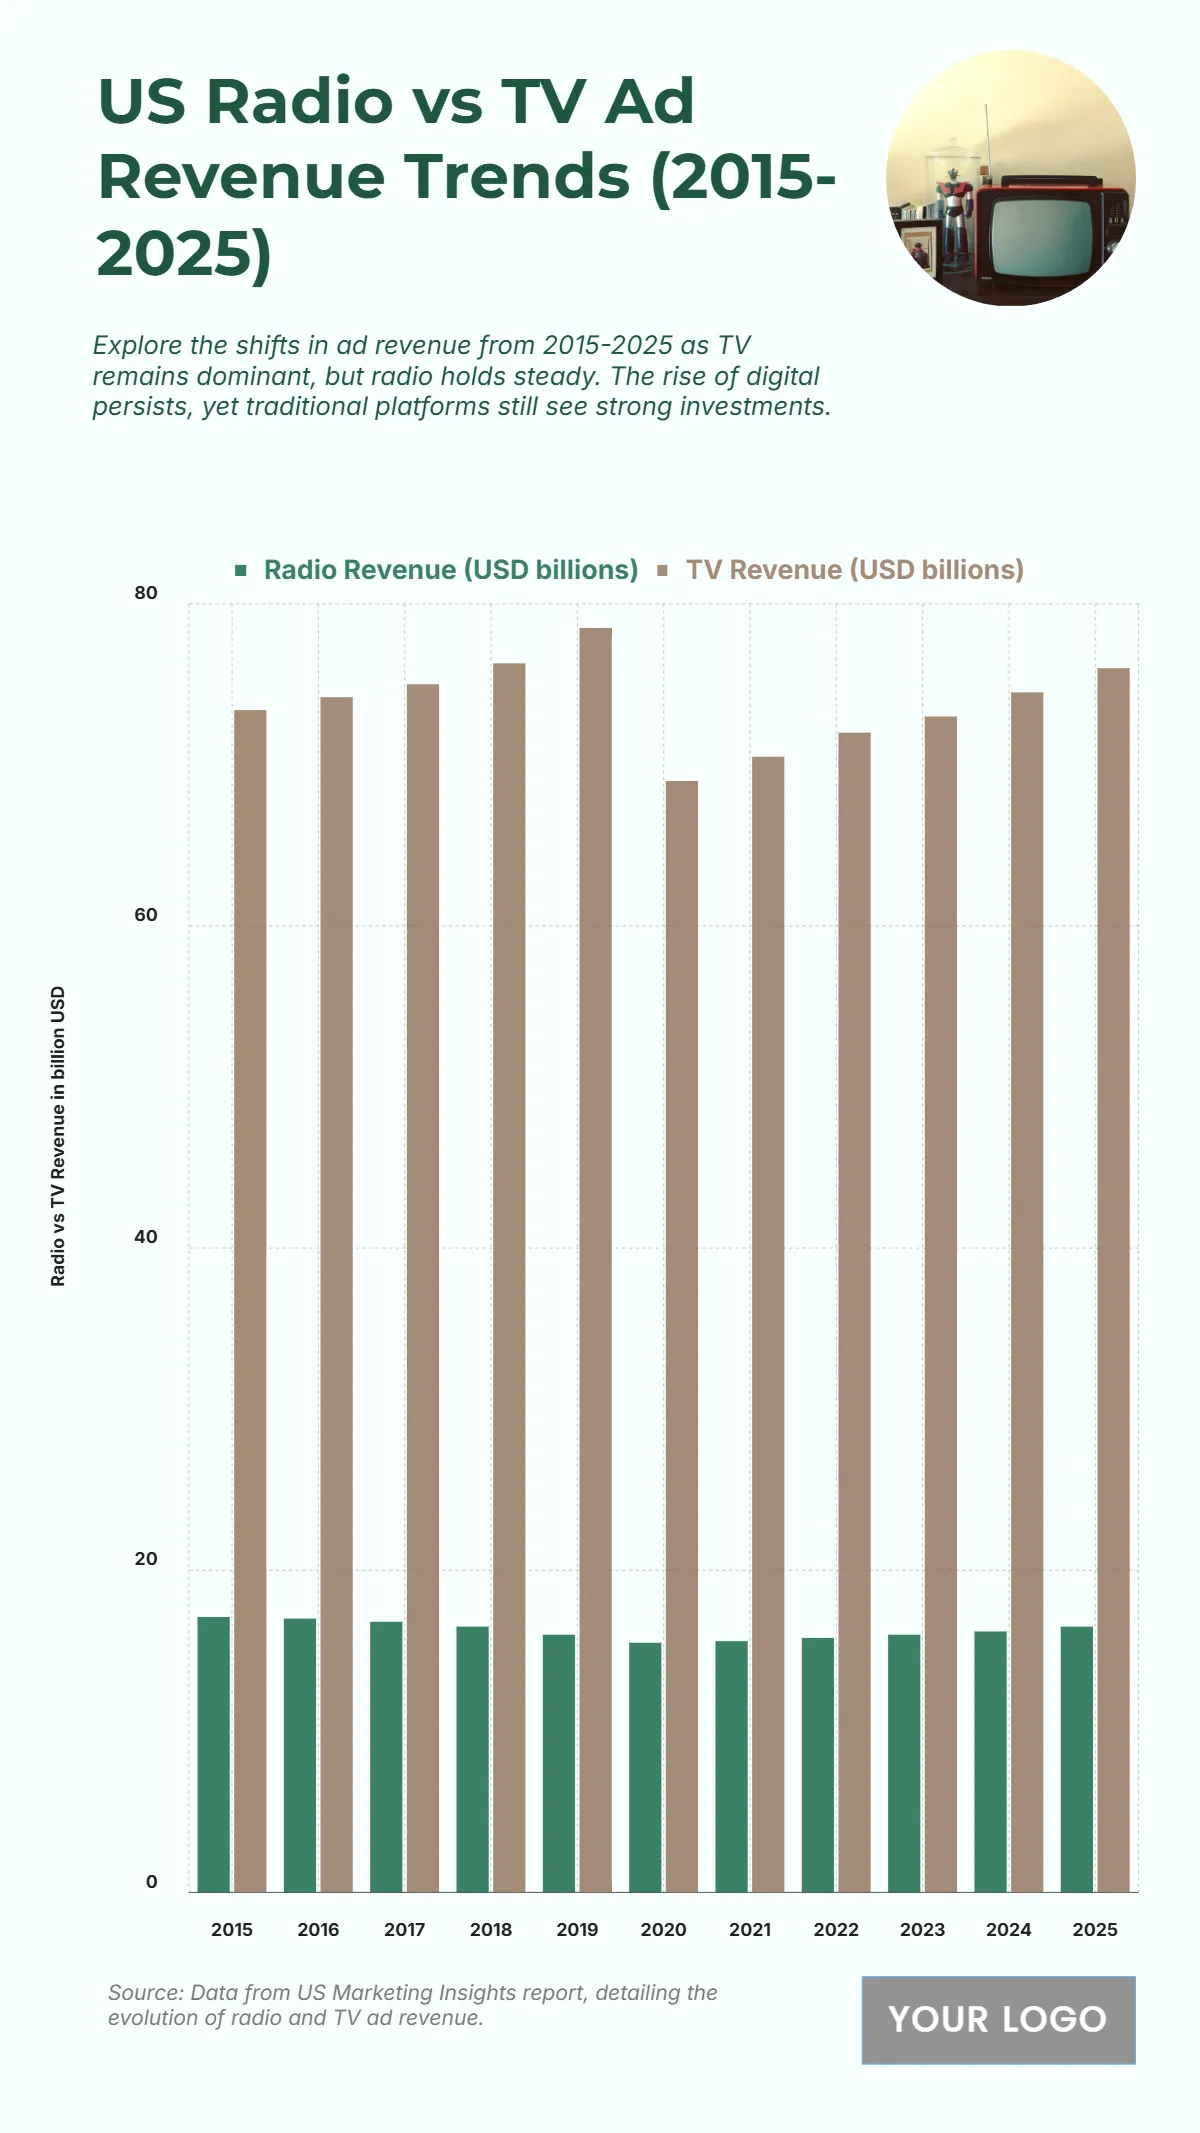
The chart shows how U.S. TV and radio ad revenues evolved from 2015 to 2025, revealing the resilience of traditional media amid the digital advertising boom. TV revenue remains consistently high, starting at $73.4 billion in 2015 and peaking at $78.5 billion in 2019, before a dip in 2020 to $69 billion, followed by gradual recovery, reaching $76 billion by 2025. This pattern highlights the stability of television as a major advertising channel despite market shifts.
Meanwhile, radio revenue maintains a steady but modest range, starting at $17.1 billion in 2015, experiencing slight declines through 2020 ($15.5 billion), then slowly climbing again to $16.5 billion in 2025. The stability in both channels underscores their continued relevance in integrated media strategies, even as digital advertising expands.
| Labels | Radio Revenue (USD billions) | TV Revenue (USD billions) |
|---|---|---|
| 2015 | 17.1 | 73.4 |
| 2016 | 17 | 74.2 |
| 2017 | 16.8 | 75 |
| 2018 | 16.5 | 76.3 |
| 2019 | 16 | 78.5 |
| 2020 | 15.5 | 69 |
| 2021 | 15.6 | 70.5 |
| 2022 | 15.8 | 72 |
| 2023 | 16 | 73 |
| 2024 | 16.2 | 74.5 |
| 2025 | 16.5 | 76 |


