Free US Advertising Revenue by Gender Demographics from 2020 to 2025 Chart
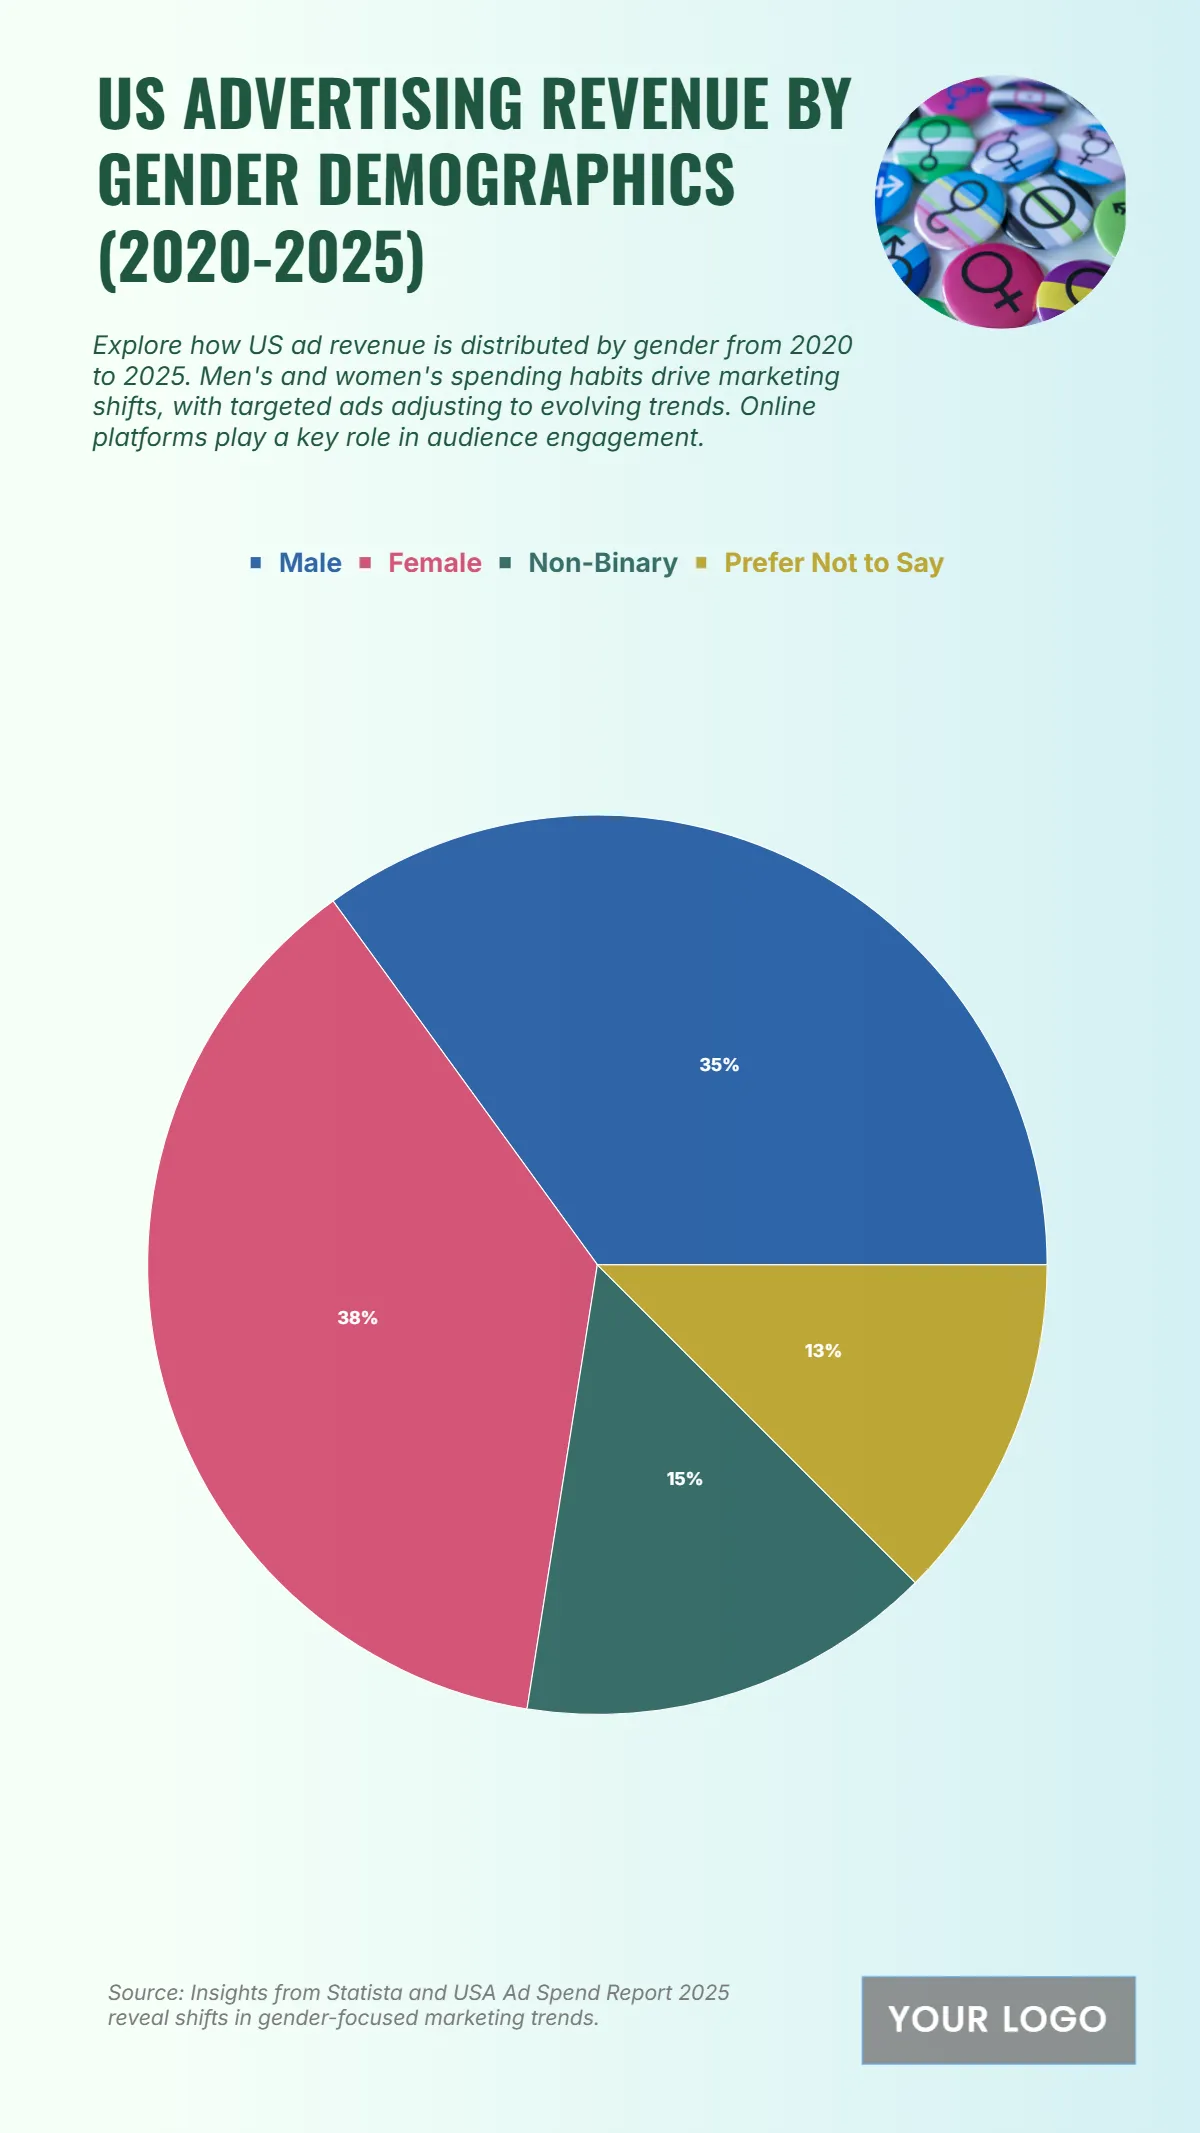
The chart shows how advertising revenue in the U.S. is distributed by gender from 2020 to 2025, emphasizing key shifts in audience engagement and spending patterns. Female audiences account for the largest share at 38%, highlighting their dominant role in driving targeted marketing strategies. Male audiences follow closely at 35%, reflecting a strong and stable consumer segment. Non-binary individuals make up 15%, indicating a growing focus on inclusive advertising and broader representation. Meanwhile, 13% of the revenue is attributed to individuals who prefer not to disclose their gender, underscoring the importance of privacy-conscious audiences in shaping campaign strategies. These percentages mirror how advertisers are adapting their approaches to capture diverse markets and respond to evolving consumer behaviors. The data points to a balanced yet strategically significant distribution that marketers can leverage to maximize impact and engagement across different gender demographics.
| Labels | Percentage (%) | 2020–2025 Revenue (USD billions) |
|---|---|---|
| Male | 35 | 70 |
| Female | 38 | 75 |
| Non-Binary | 15 | 30 |
| Prefer Not to Say | 13 | 25 |


