Get Access to World’s largest Template Library & Tools

How to Create a Waterfall Chart in Microsoft Excel


Microsoft Excel‘s Waterfall Chart feature offers a dynamic way to represent financial data, illustrating how initial values are affected by subsequent positive and negative changes. Ideal for financial consultants, analysts, accountants, and anyone keen on visualizing cumulative effect, mastering the creation of a Waterfall Chart is vital for conveying complex financial information simply.
How to Create a Waterfall Chart in Microsoft Excel


Creating a Waterfall Chart in Microsoft Excel is an excellent way to visually display the cumulative impact of sequential positive and negative values, making it a popular choice for financial analysis and reporting. Follow these steps to create a Waterfall Chart that can effectively communicate your data insights.

  • Step 1. Prepare Your Data

    Organize your data in a table format with your values in one column and their corresponding descriptions in another. Ensure you have the initial value, followed by the subsequent increases or decreases, and finally, the ending value.

  • Step 2. Select Your Data

    Highlight the data range you want to include in the chart. This includes both the descriptions and the values. Make sure to include any headers as they will help in identifying the chart elements.

  • Step 3. Insert the Waterfall Chart

    step 3 insert the waterfall chart

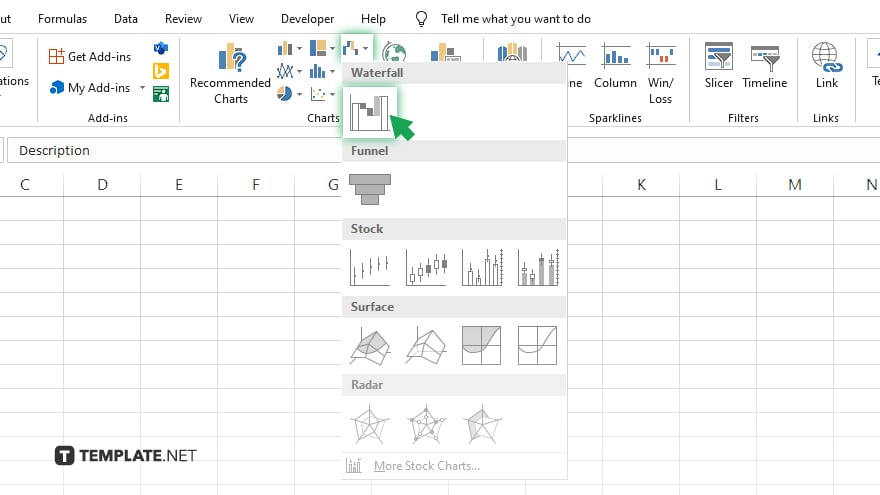
    Go to the ‘Insert’ tab on the Excel ribbon, click the ‘Insert Waterfall or Stock Chart’ icon, and choose ‘Waterfall.’ Excel will generate a basic Waterfall Chart based on your selected data.

  • Step 4. Customize the Chart

    step 4 customize the chart

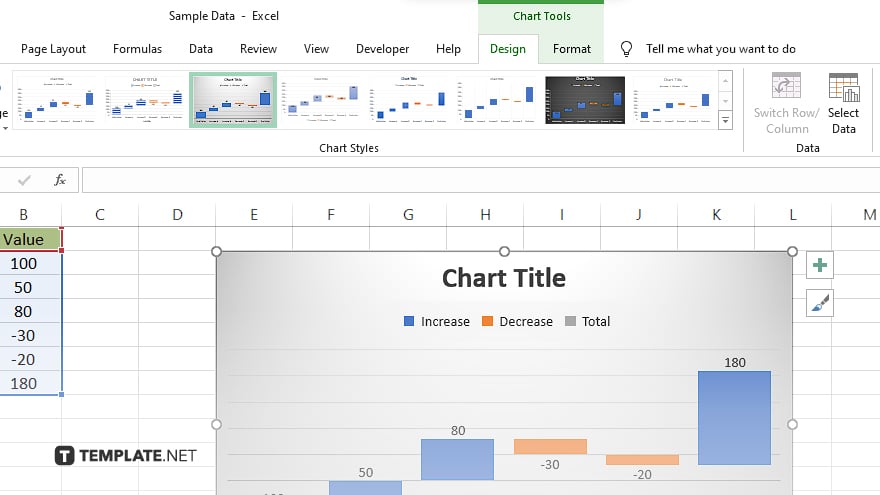
    Once your chart is created, you can customize it to fit your needs. Use the Chart Tools on the ribbon, which appears under ‘Design’ and ‘Format,’ to modify the chart’s title, labels, colors, and overall style. To adjust specific elements like the starting and ending totals, click on the data point and right-click to access formatting options.

  • Step 5. Finalize and Review

    Review your Waterfall Chart for accuracy and clarity. Make any necessary adjustments to ensure it represents the financial story you wish to tell. Once satisfied, you can save, print, or incorporate the chart into presentations or reports.

You may also find valuable insights in the following articles offering tips for Microsoft Excel:

note iconNote

Unlock Your Productivity with Over 100,000 Microsoft Excel Templates! Exclusively Available at Template.net – Download Now and Transform Your Data Handling Experience!

FAQs

Can I add data labels to my Waterfall Chart in Excel for better clarity?

Yes, you can add data labels by clicking on the chart, and then selecting ‘Add Chart Element’ > ‘Data Labels’ from the Chart Design tab.

How do I change the color of specific bars in the Waterfall Chart?

Click on the bar you wish to change, then right-click and choose ‘Format Data Point’ to select a new fill color.

Is it possible to create a Waterfall Chart in Excel versions older than 2016?

Direct creation of Waterfall Charts is not available in Excel versions older than 2016, but you can manually construct a similar chart using stacked column charts and strategic formatting.

Can the Waterfall Chart in Excel include both positive and negative values?

Yes, Waterfall Charts are designed to effectively display both increases (positive values) and decreases (negative values) across the data series.

How do I make the total columns stand out in a Waterfall Chart?

You can format the total columns differently by clicking on them to select them, then right-clicking and choosing ‘Format Data Point’ to apply distinct colors or styles.

More in Excel

How to Clear Table Format in Microsoft ExcelHow to Extract the Year From a Date in Microsoft Excel
How to Do a Bar Graph in Microsoft ExcelHow to Change Theme in Microsoft Excel
How to Calculate Cells in Microsoft ExcelHow to Label X and Y Axis on Microsoft Excel
How to Change Print Area in Microsoft ExcelHow to Add 2 Cells in Microsoft Excel
How to Write Vertically in Microsoft ExcelHow to Display All Formulas in Microsoft Excel
How to Change the Chart Style in Microsoft ExcelHow to Enter Bullet Points in Microsoft Excel
How to Change a Microsoft Excel File from Read OnlyHow to Show the Ribbon in Microsoft Excel
How to Make a Clustered Column Chart in ExcelHow to See Duplicates in Microsoft Excel
How to Trim in Microsoft ExcelHow to Do a Scatter Plot in Microsoft Excel
How to Switch Cells in Microsoft ExcelHow to Calculate Workdays in Microsoft Excel
How to Make a Macro in Microsoft ExcelHow to Create a Sensitivity Table in Microsoft Excel
How to Calculate a Percentage in Microsoft ExcelHow to Freeze 2 Rows in Microsoft Excel
How to Import a File Into Microsoft ExcelHow to Email a Microsoft Excel Sheet
How to Create Labels in Word From Microsoft ExcelHow to Auto-Adjust Row Height in Microsoft Excel
How to Combine Tabs in Microsoft ExcelHow to Wrap Text in a Microsoft Excel Cell
How to Autofill the Date in Microsoft ExcelHow to Fix a Circular Reference in Microsoft Excel
How to Add a Label to an Axis in Microsoft ExcelHow to Select a Row in Microsoft Excel
How to Lock Cells in Microsoft Excel for ScrollingHow to Get Microsoft Excel to Round Up
How to Start a New Paragraph in Microsoft ExcelHow to Insert Check Boxes in Microsoft Excel
How to Change Horizontal Axis Values in Microsoft ExcelHow to Enable the Developer Tab in Microsoft Excel
How to Copy a Row in Microsoft ExcelHow to Delete Extra Pages in Microsoft Excel
How to Change a CSV File to Microsoft ExcelHow to Share and Edit Microsoft Excel Files
How to Find a P-Value in Microsoft ExcelHow to Compare Two Microsoft Excel Sheets for Duplicates
How to Delete a Chart in Microsoft ExcelHow to Put Dates in Order on Microsoft Excel
How to Freeze Both Rows and Columns in Microsoft ExcelHow to Recover a Corrupted Microsoft Excel File
How to Save a Microsoft Excel File as a CSVHow to Unprotect a Microsoft Excel Spreadsheet
How to Add Rows in Microsoft Excel Using a ShortcutHow to Do a Count in Microsoft Excel
How to Find the Sum of a Column in Microsoft ExcelHow to Make a Note in Microsoft Excel
How to Find the Slope on a Microsoft Excel GraphHow to Remove #DIV/0 in Microsoft Excel
How to Insert Symbols in Microsoft ExcelHow to Budget With Microsoft Excel
How to Reorder Rows in Microsoft ExcelHow to Calculate the Total in Microsoft Excel
How to Search a Microsoft Excel DocumentHow to Autofit Cells in Microsoft Excel
How to Get the Total in Microsoft ExcelHow to Get Rid of Dashed Lines in Excel
How to Find the P-Value in Microsoft ExcelHow to Sort by Alphabetical Order in Microsoft Excel
How to Make Sequential Numbers in Microsoft ExcelHow to Add Boxes in Microsoft Excel
How to Graph Using Microsoft ExcelHow to Change the Default Font in Microsoft Excel
How to Add Today's Date in Microsoft ExcelHow to Move Rows Up in Microsoft Excel
How to Delete a Tab in Microsoft ExcelHow to Freeze the First Two Rows in Microsoft Excel
How to Separate Words in Excel Using a FormulaHow to Rename a Microsoft Excel File
How to Budget on Microsoft ExcelHow to Budget in Microsoft Excel
How to Fix a Row in Microsoft ExcelHow to Extract Data From PDF to Microsoft Excel
How to Create Column Headers in Microsoft ExcelHow to Filter by Date in Microsoft Excel
How to Make a Grid in Microsoft ExcelHow to Total Columns in Microsoft Excel
How to Create a Rule in Microsoft ExcelHow to Fill Every Other Row in Microsoft Excel
How to Convert Currency in Microsoft ExcelHow to Do a Subtraction Formula in Microsoft Excel
How to Embed a Document in Microsoft ExcelHow to Delete Infinite Columns in Microsoft Excel
How to Insert an Arrow in Microsoft ExcelHow to Sign in in Microsoft Excel
How to Expand Rows in Microsoft ExcelHow to Enter in an Excel Cell
How to Anchor Cells in Microsoft ExcelHow to Plot a Graph in Microsoft Excel
How To Multiply 2 Cells in Microsoft ExcelHow to Make Microsoft Excel Files Smaller
bottom banner