What Is a Management Gantt Chart?
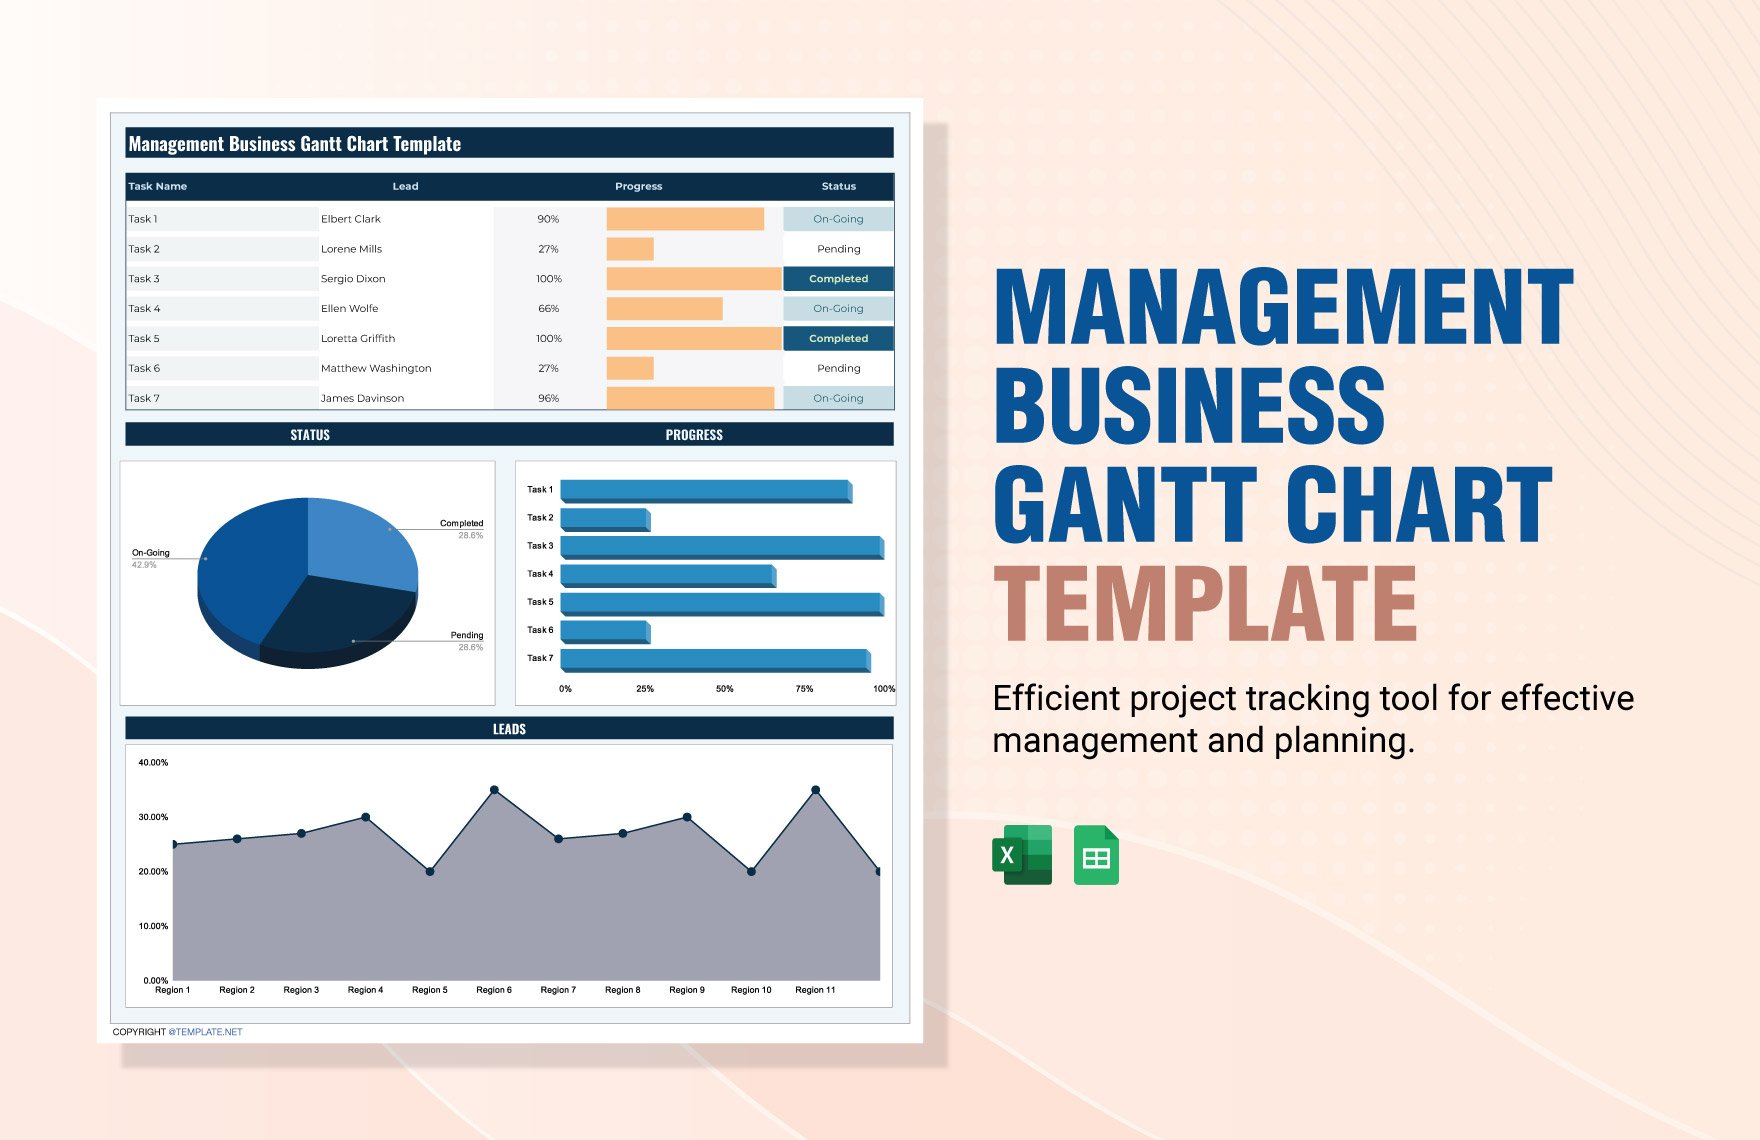
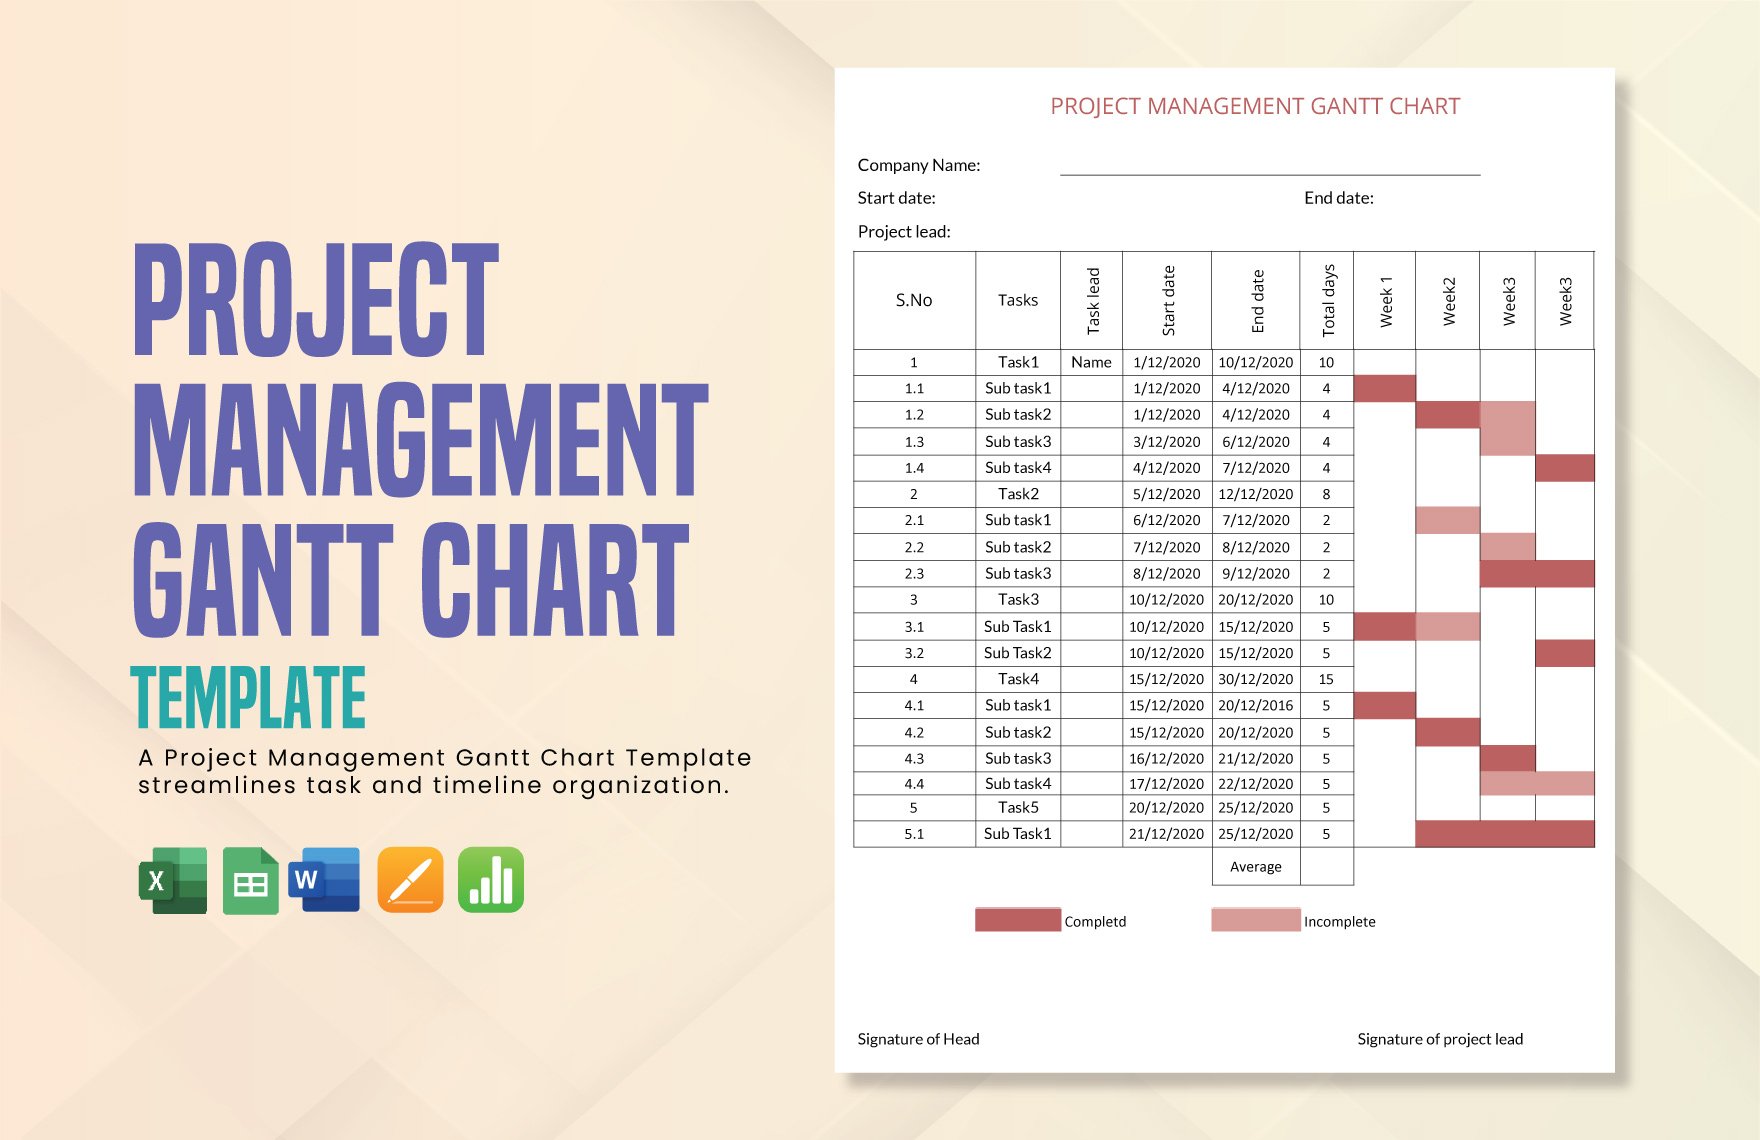
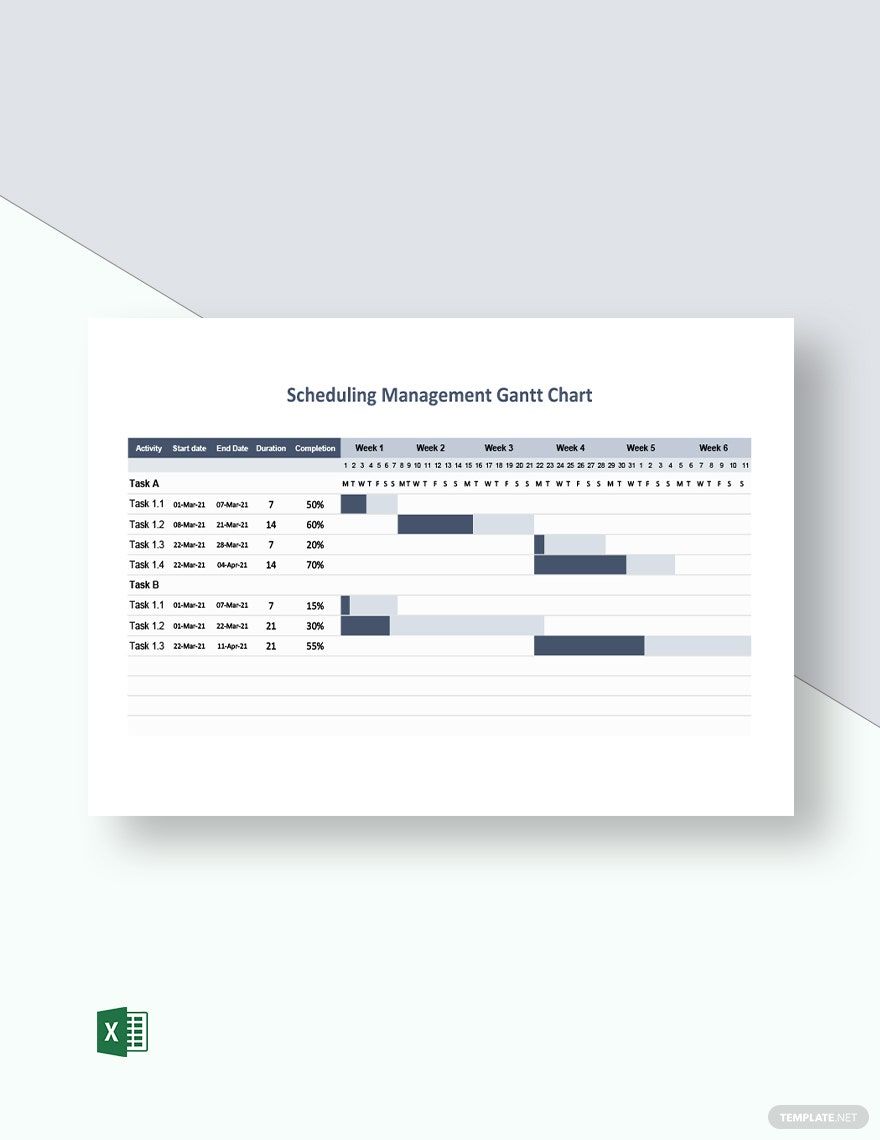
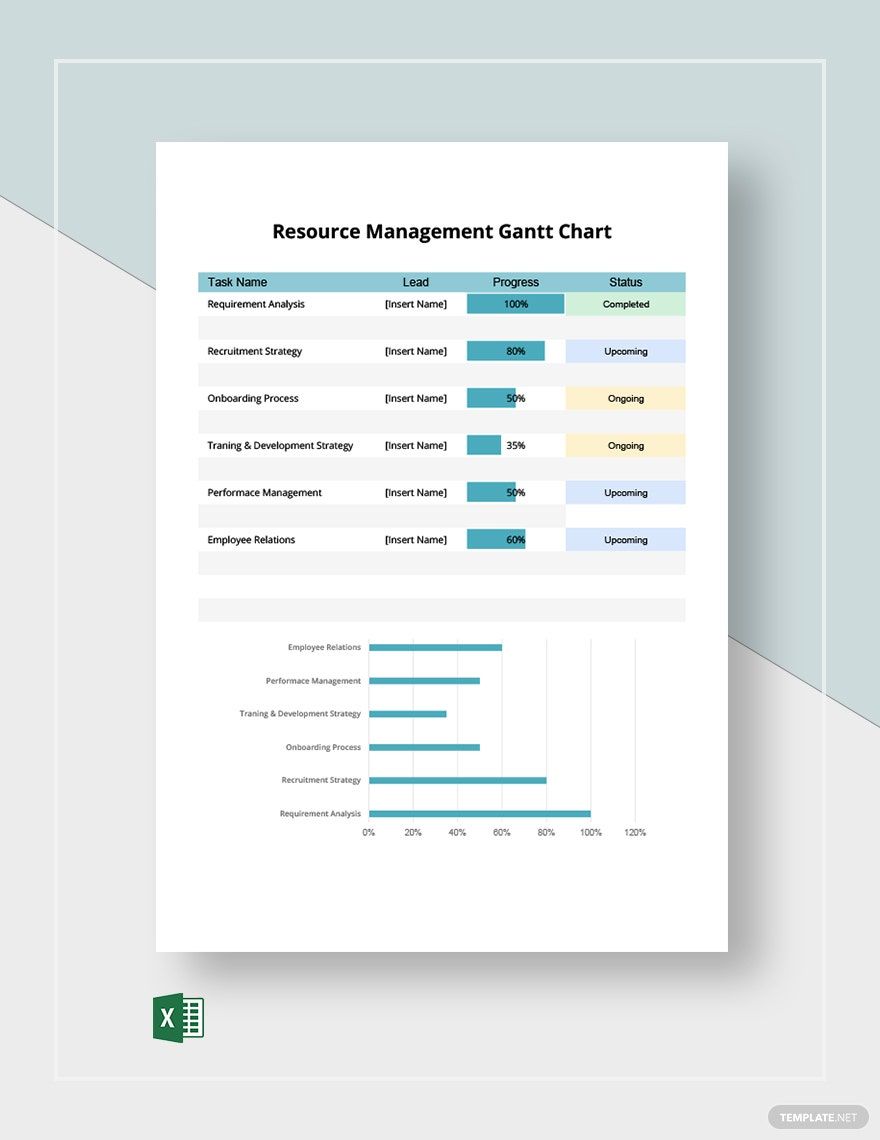
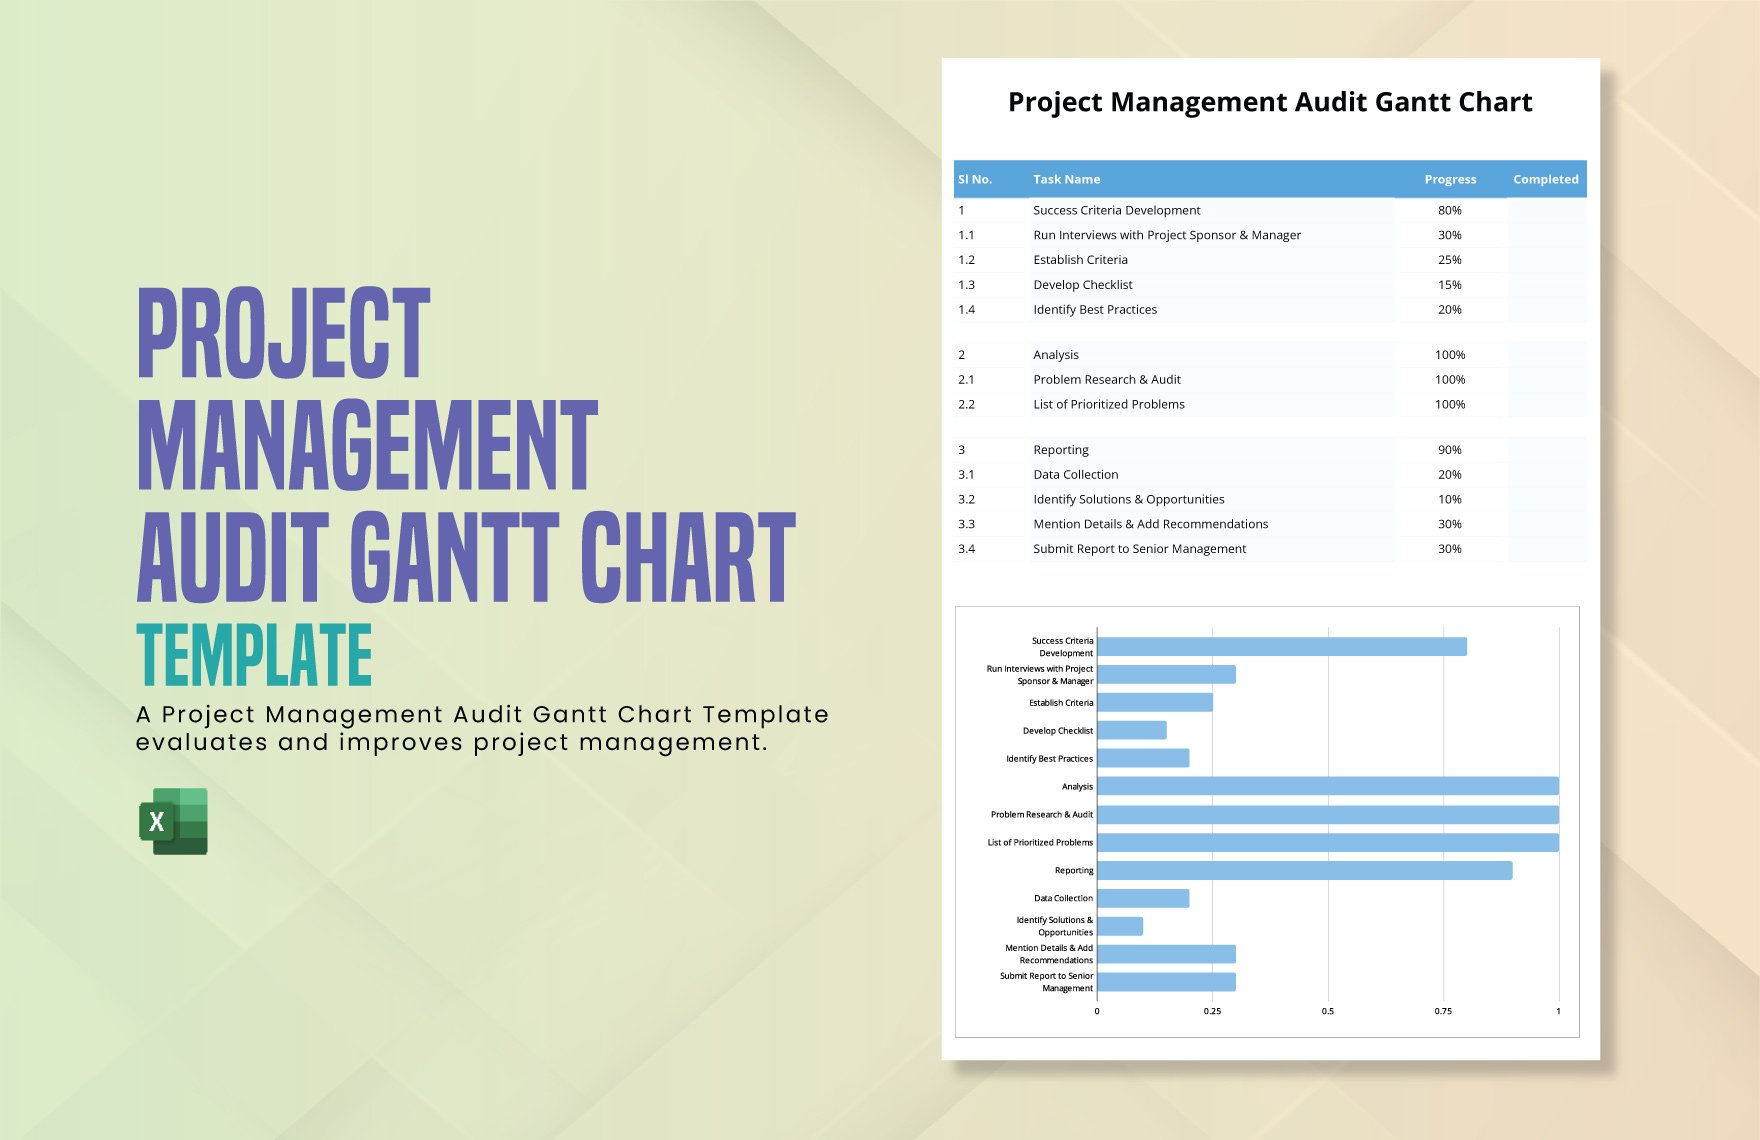
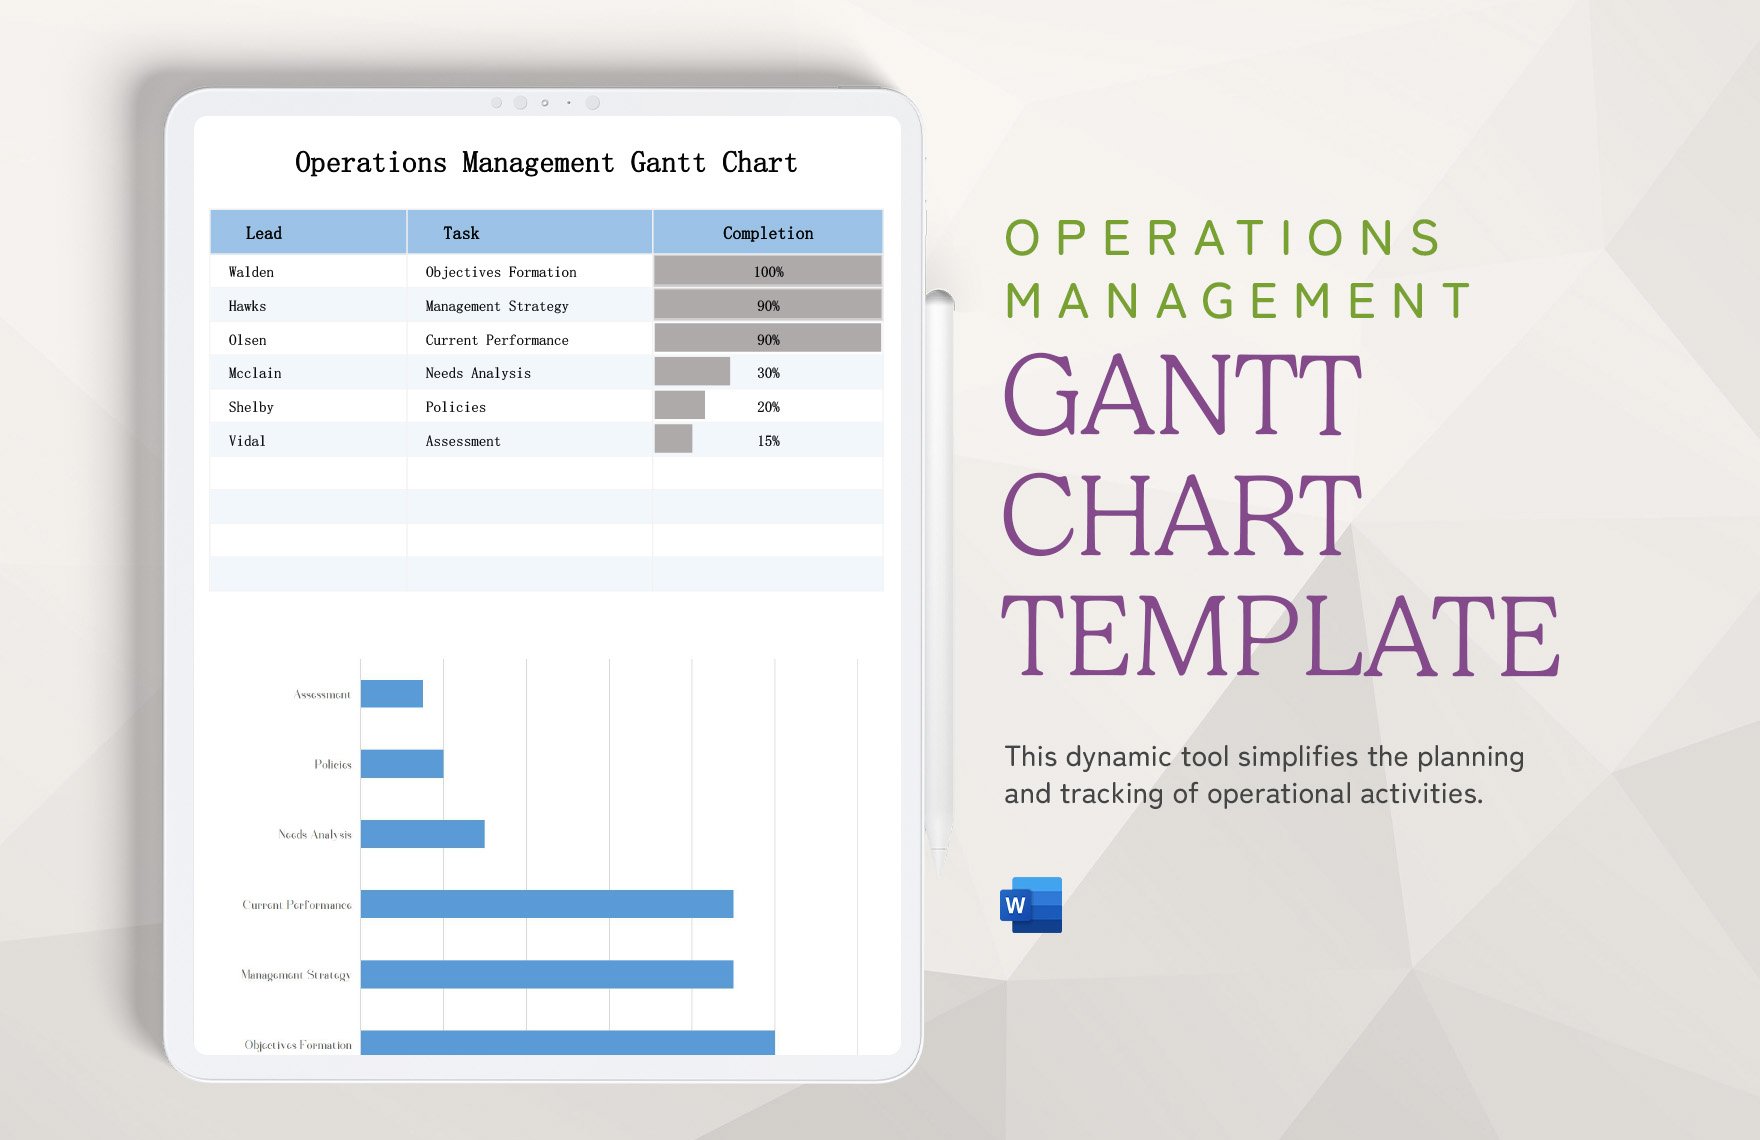
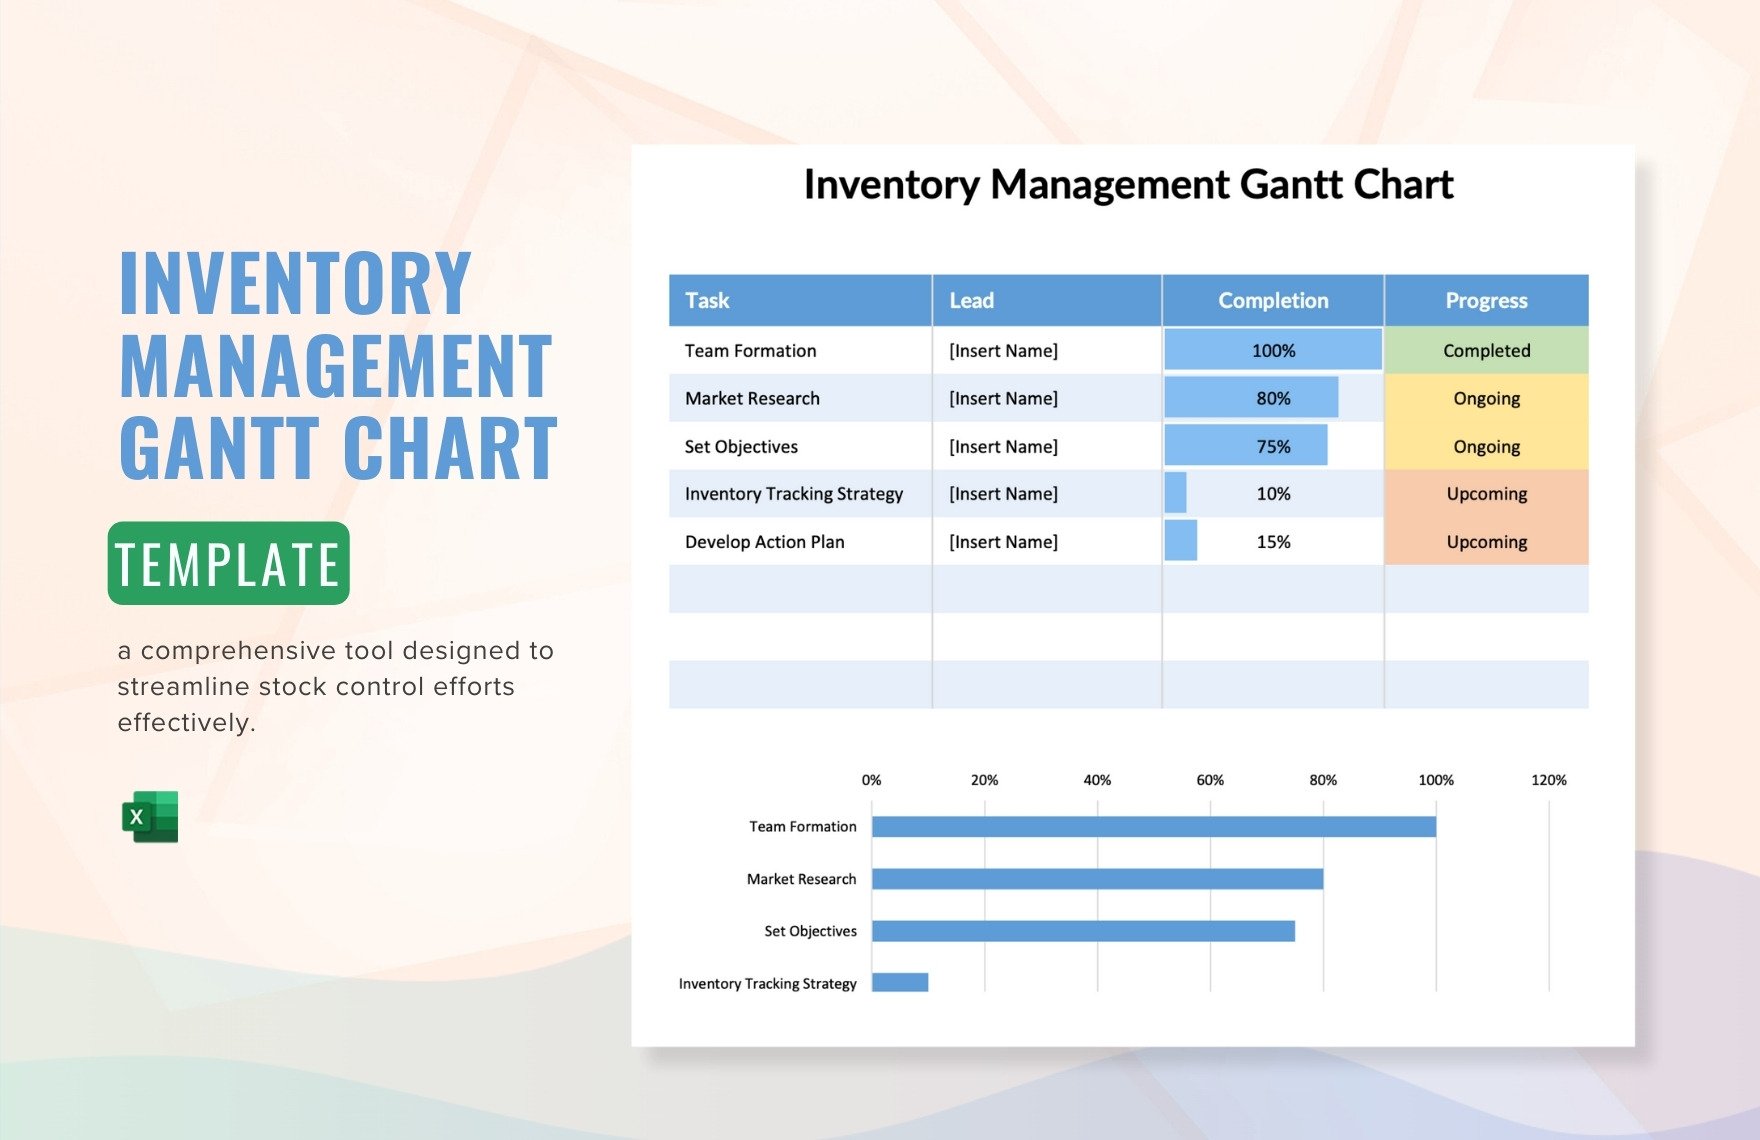
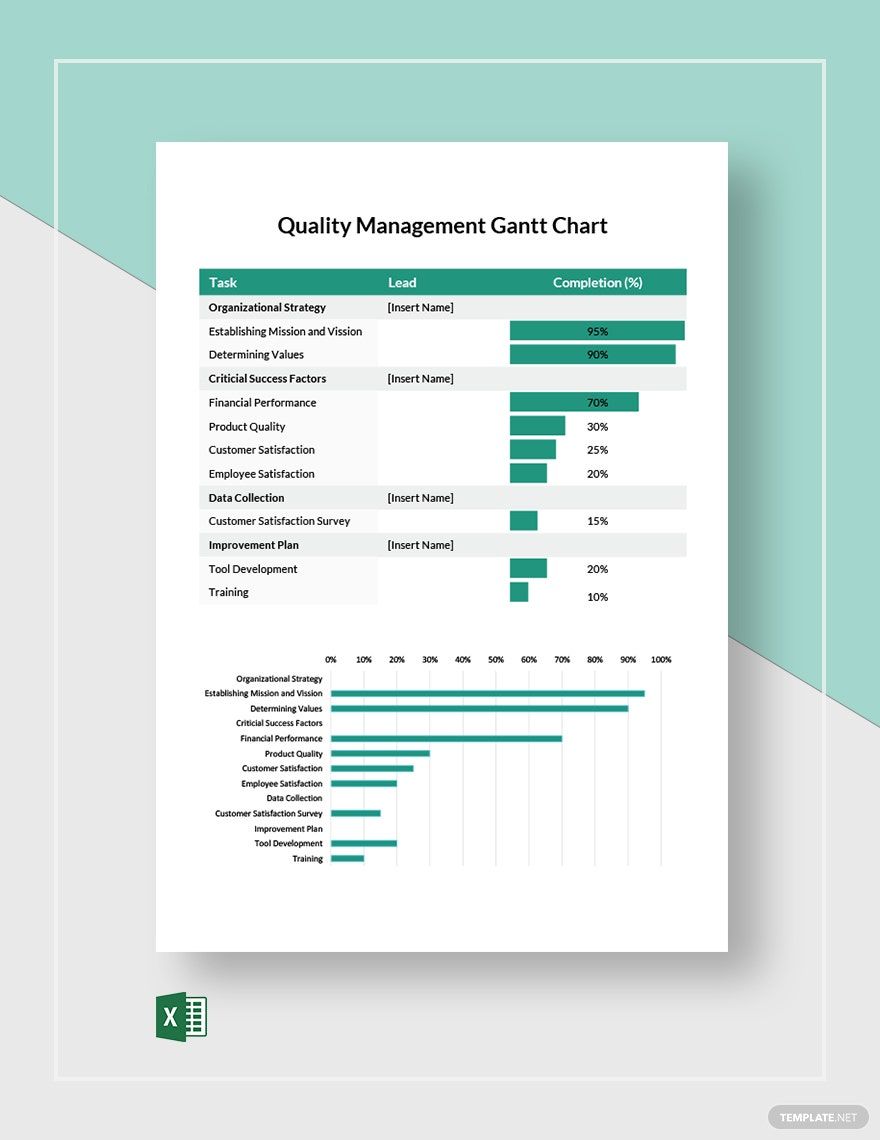
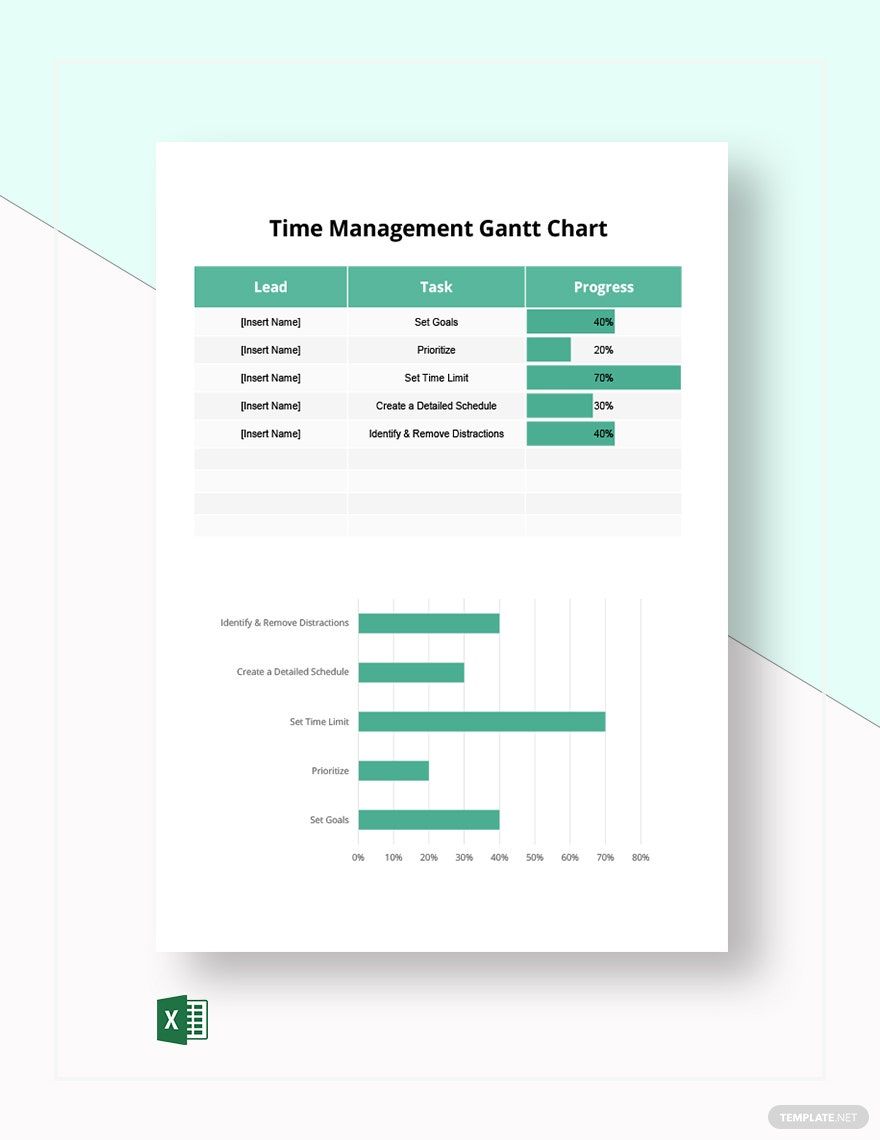
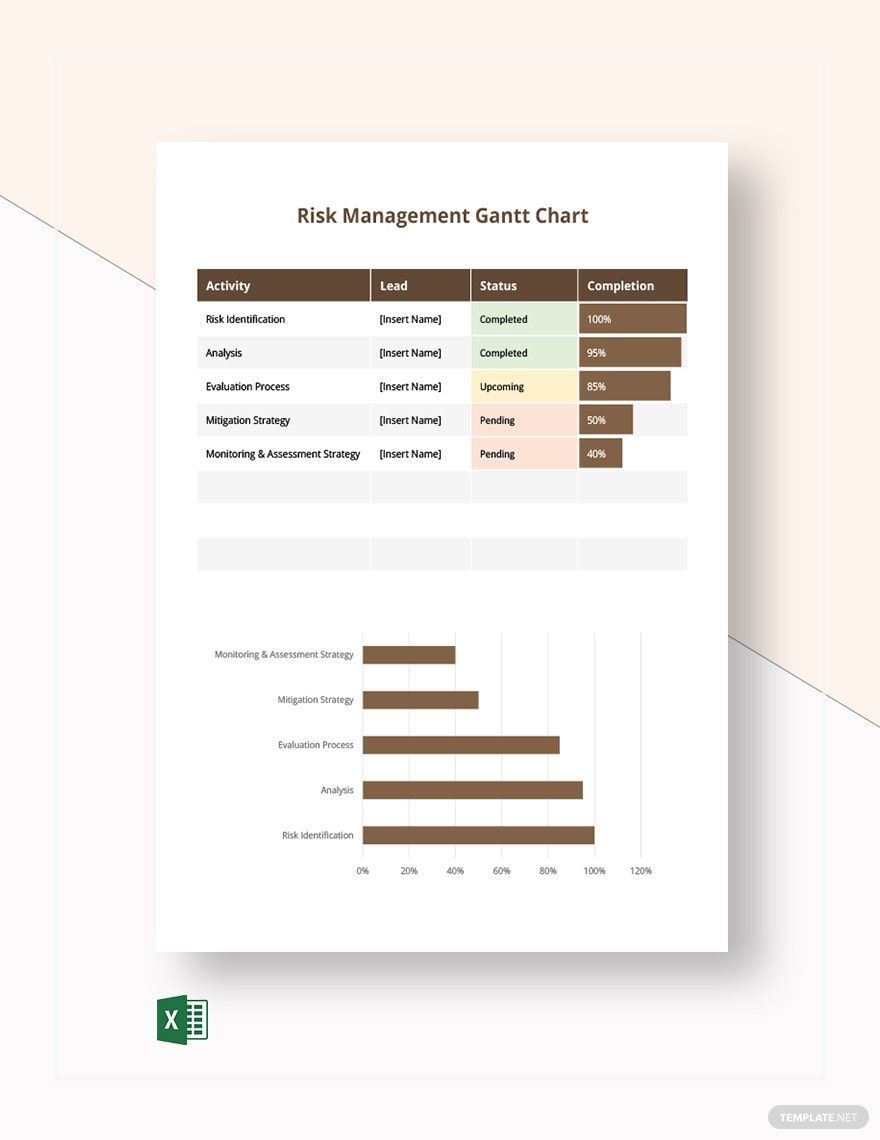
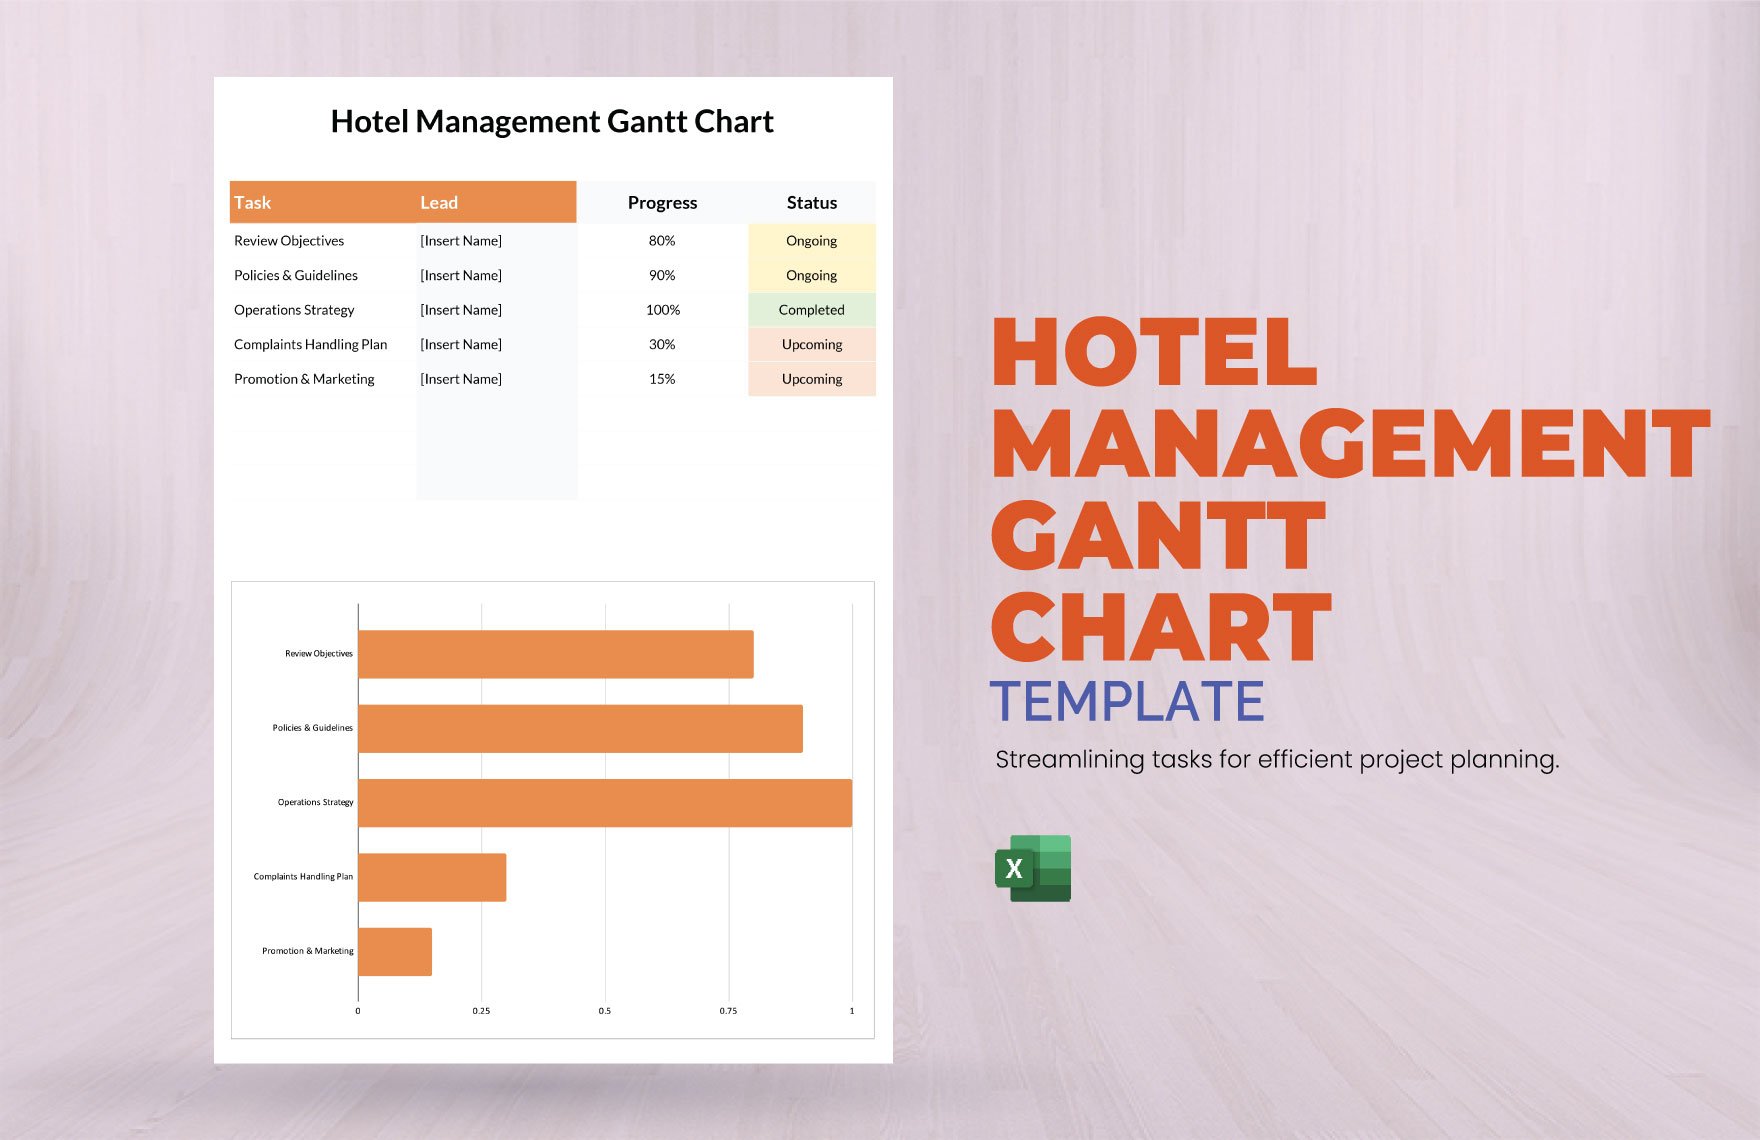
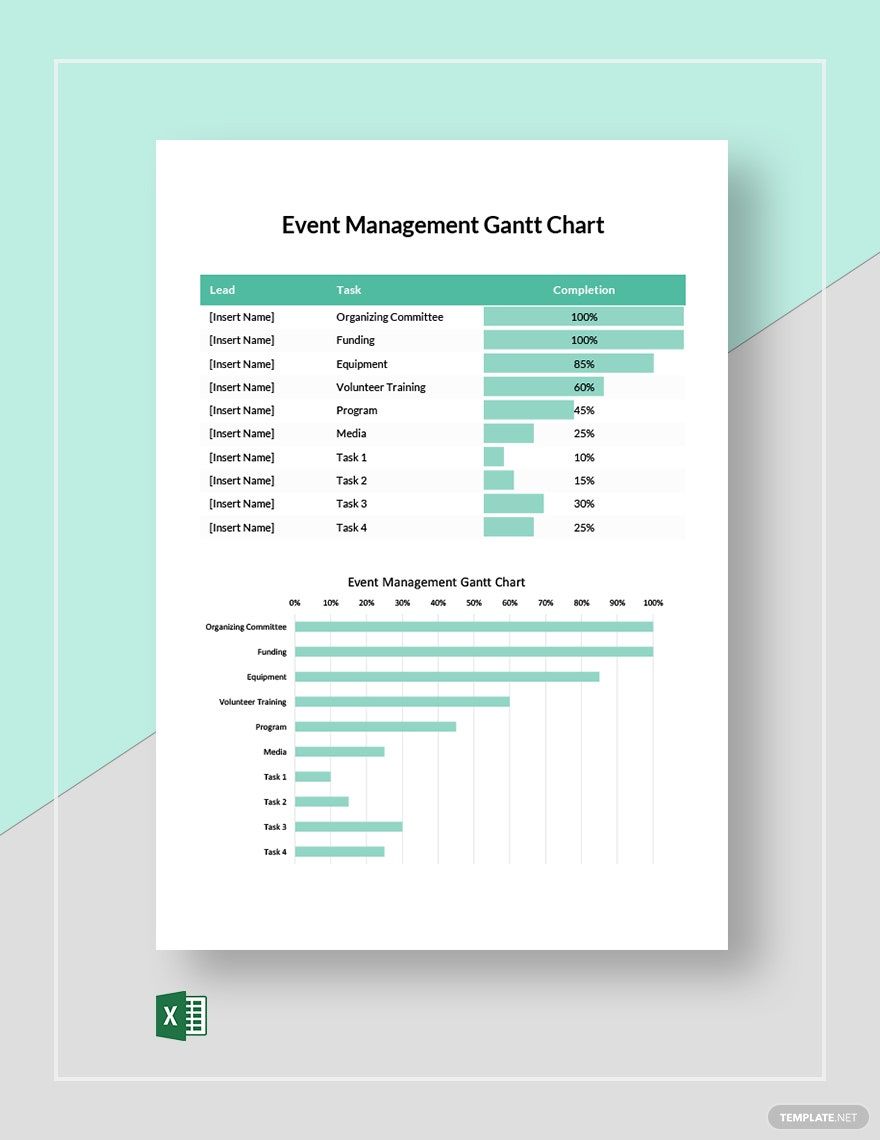
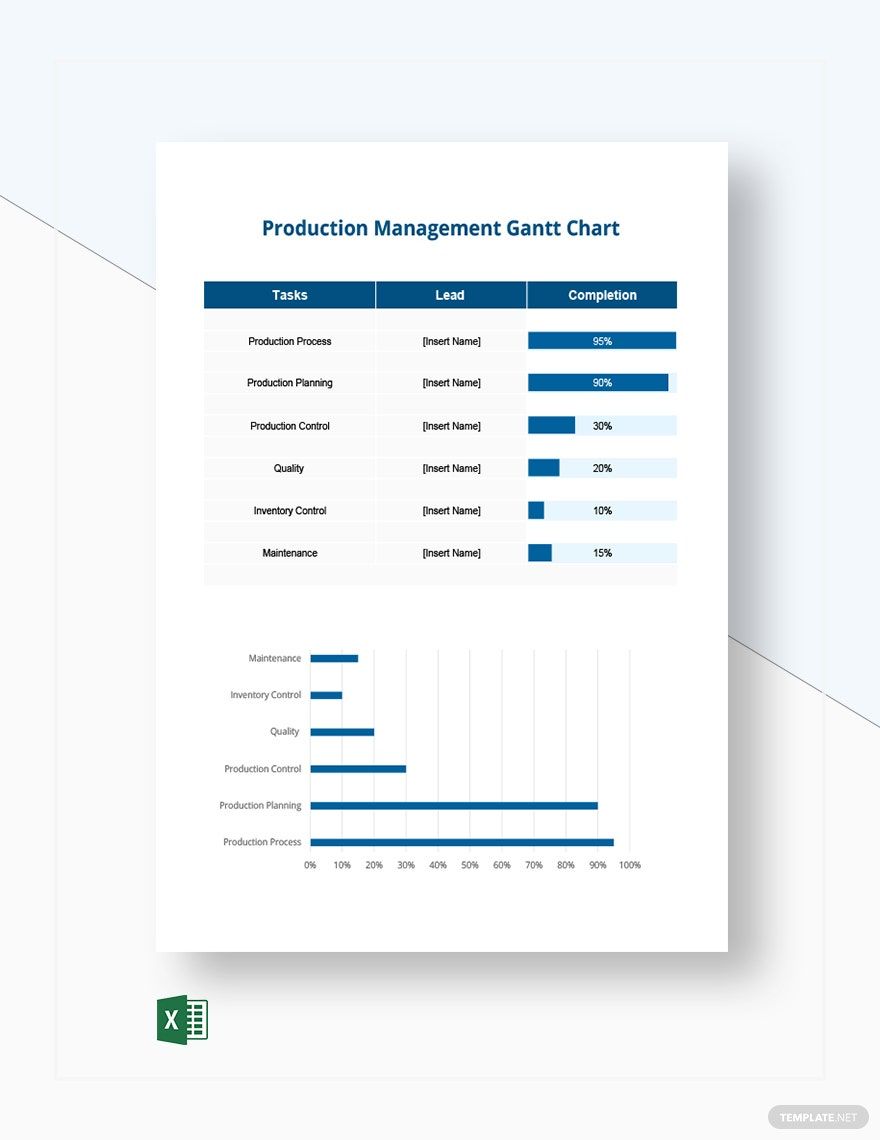
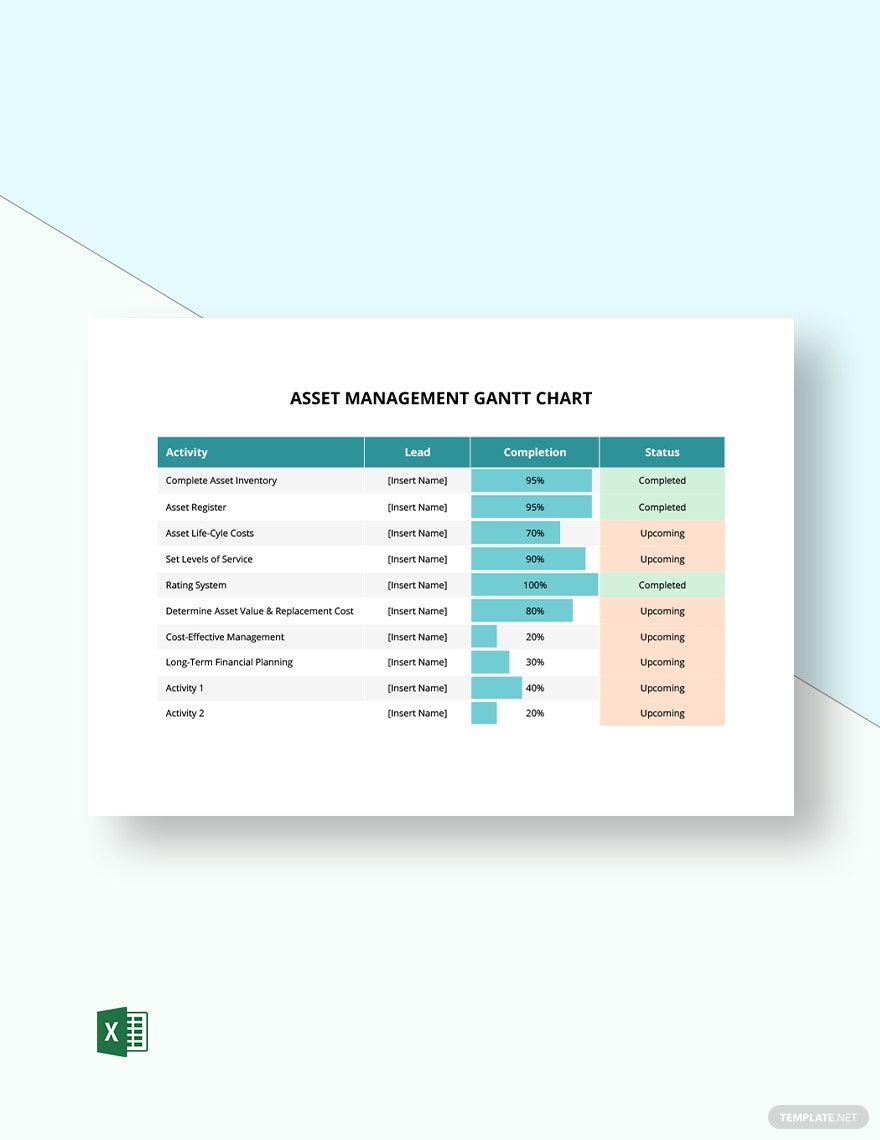
A management Gantt chart is a schedule diagram that's specifically used for managing projects. These include construction projects, engineering projects, and software projects, to name a few. According to the website, AnalysisTabs, Business Gantt charts are easy to use and will provide you with a clear representation of time frames.
How to Make a Management Gantt Chart?
Start managing your projects and activities by making your own Gantt chart. Even if this isn't your first time, we’ve provided you with guidelines to help in making the process easier.
1. Determine the Extent of the Project
When managing a project, the first thing that you should do is determine how heavy the project is. This will help you determine how much time you need for it. Also, this will help you set the budget and manpower that you'll need for your company Gantt chart.
2. Identify the Different Tasks to Complete
After gathering information about the project, start making a to-do list of the tasks. You can do this by breaking down the whole project into smaller and more manageable tasks. Write as many tasks as possible, you'll still need to narrow it down once you actually start working on the chart.
3. Start Creating Your Gantt Chart
With the help of a document or spreadsheet processor, you can start creating the framework of your management or marketing Gantt chart. Choose from among the most commonly used tools, such as Word, Excel, Pages, or Numbers. What's important is that it allows you to design your chart without hassle.
4. Add the Tasks and Dates
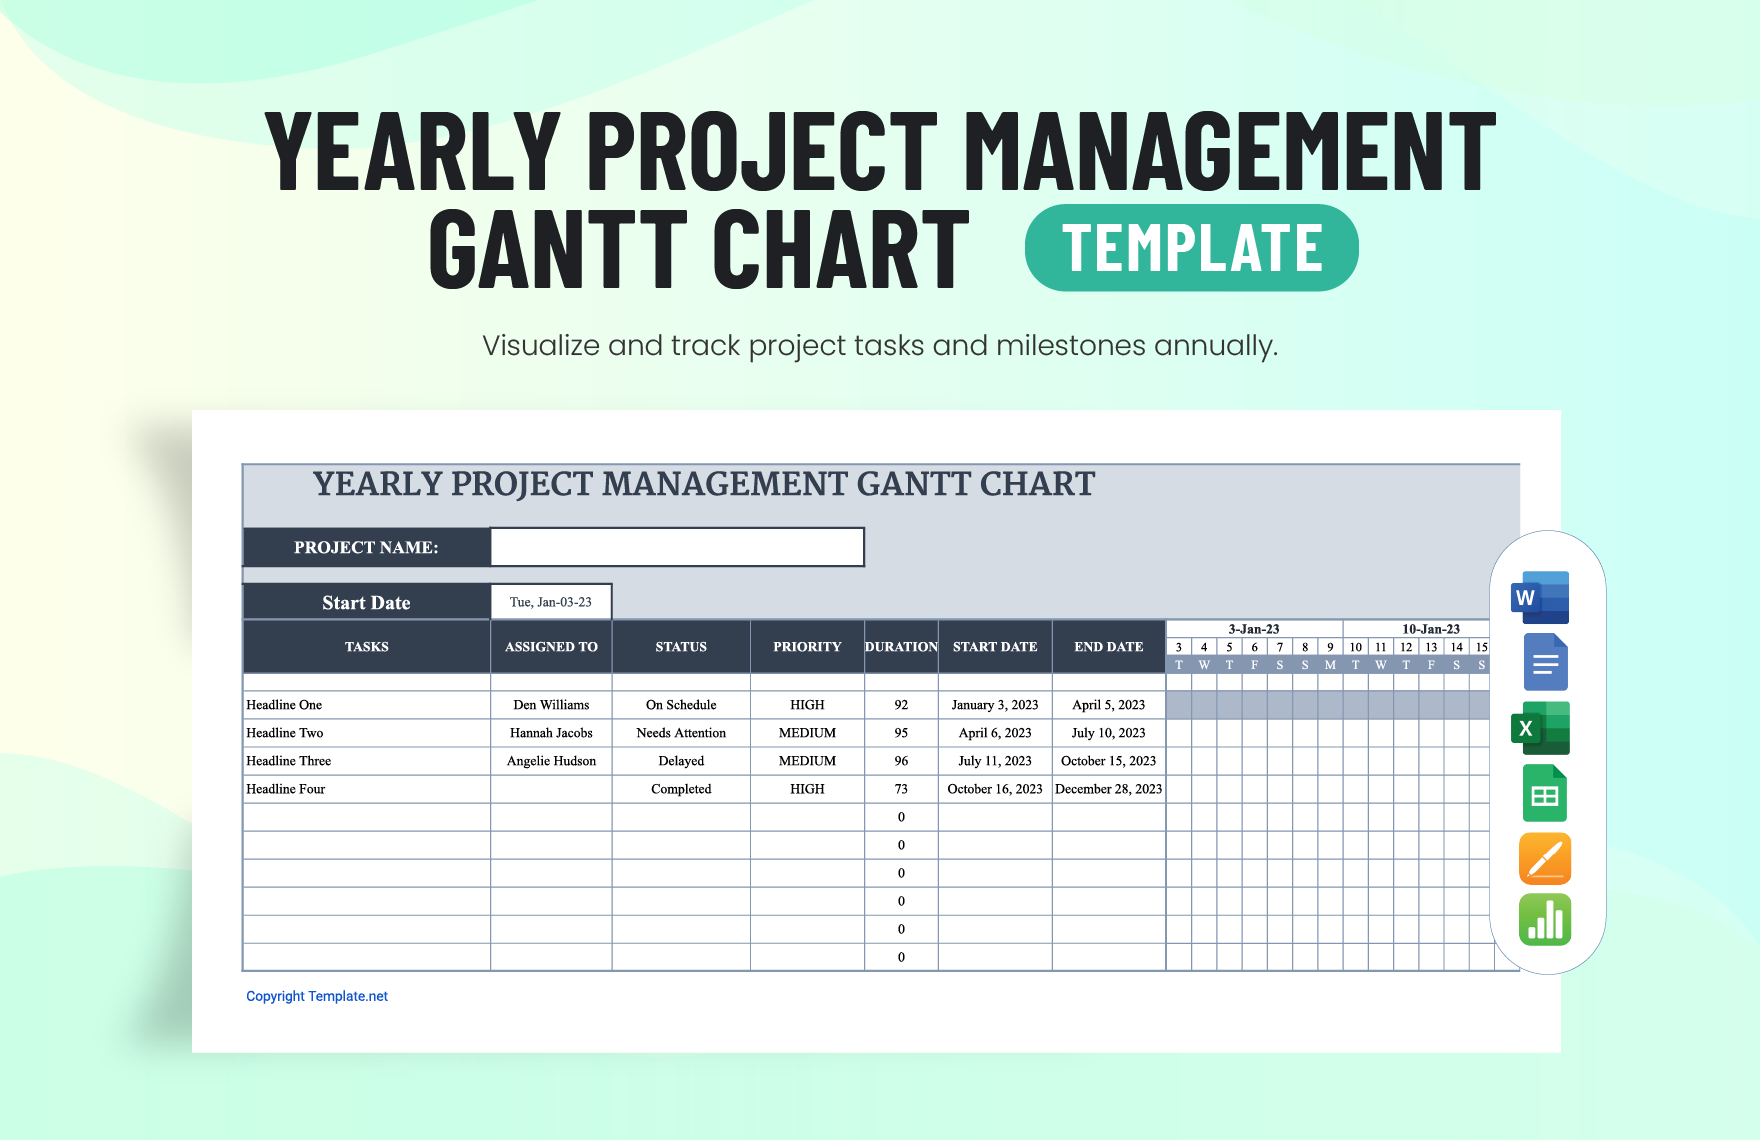
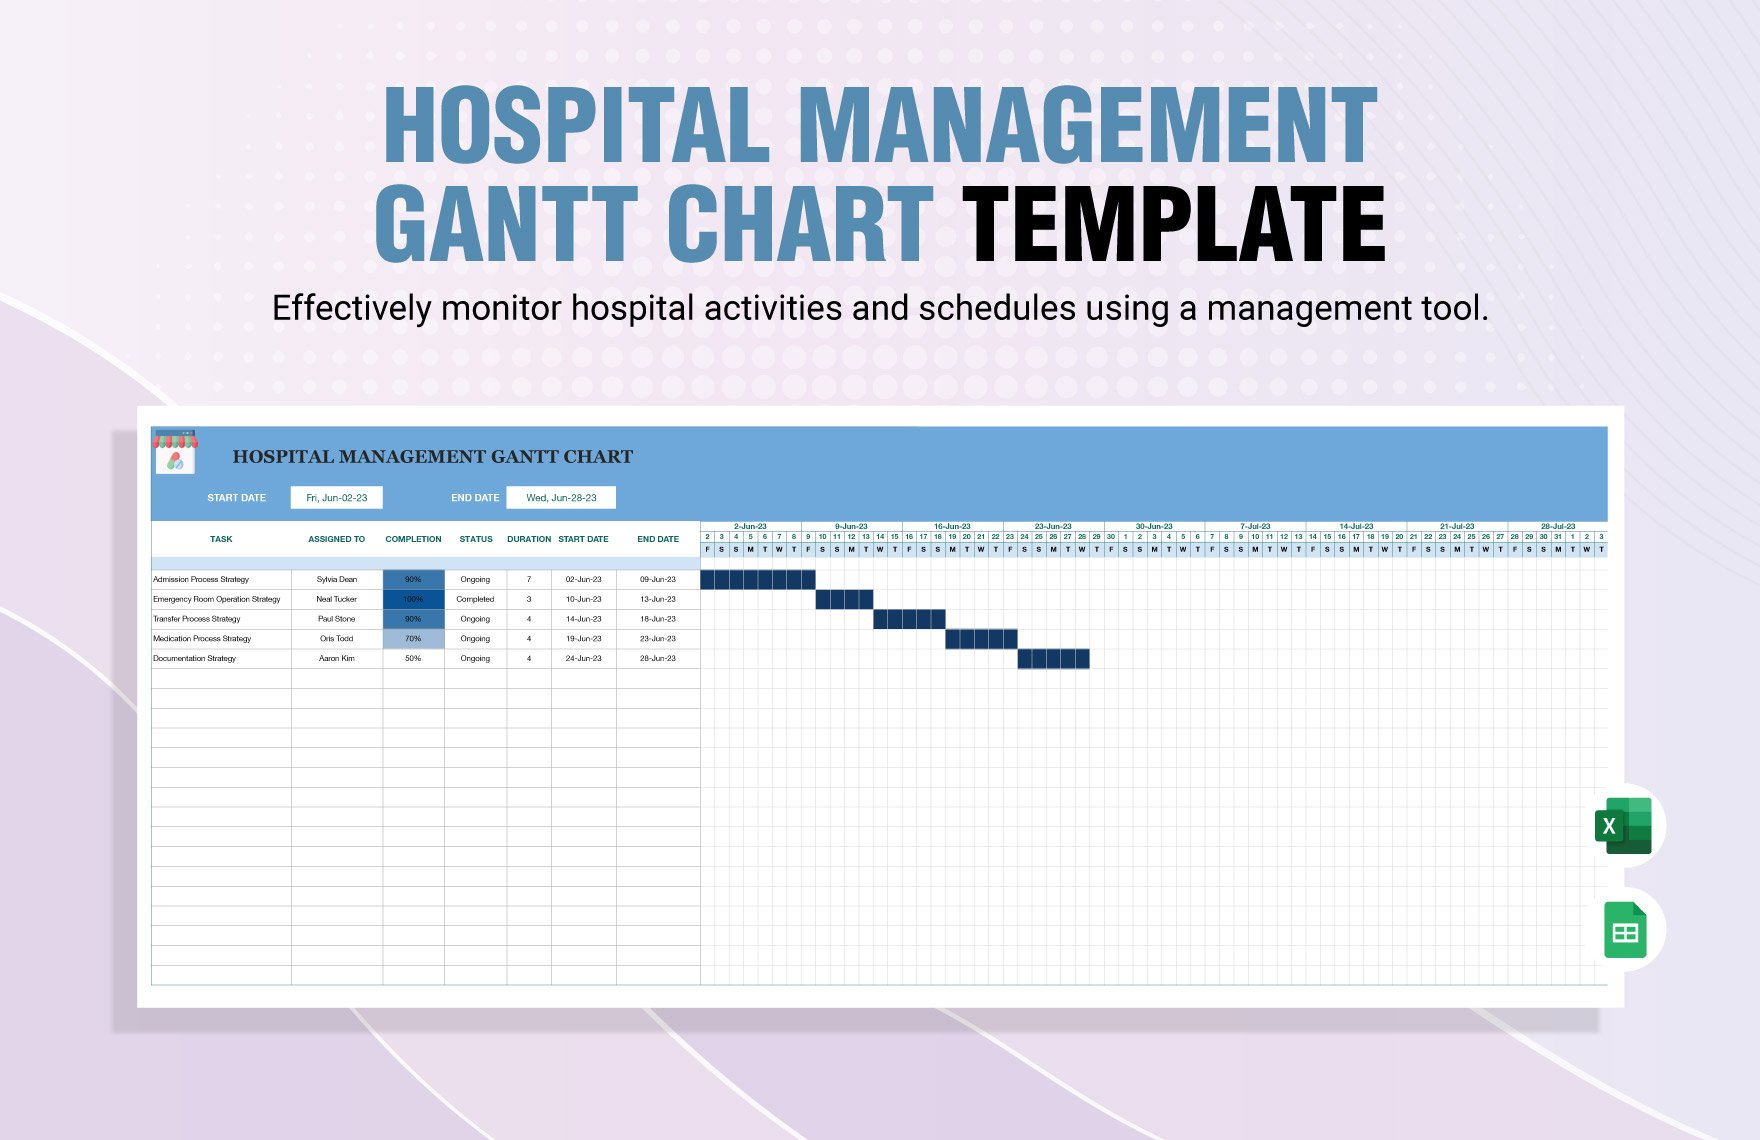
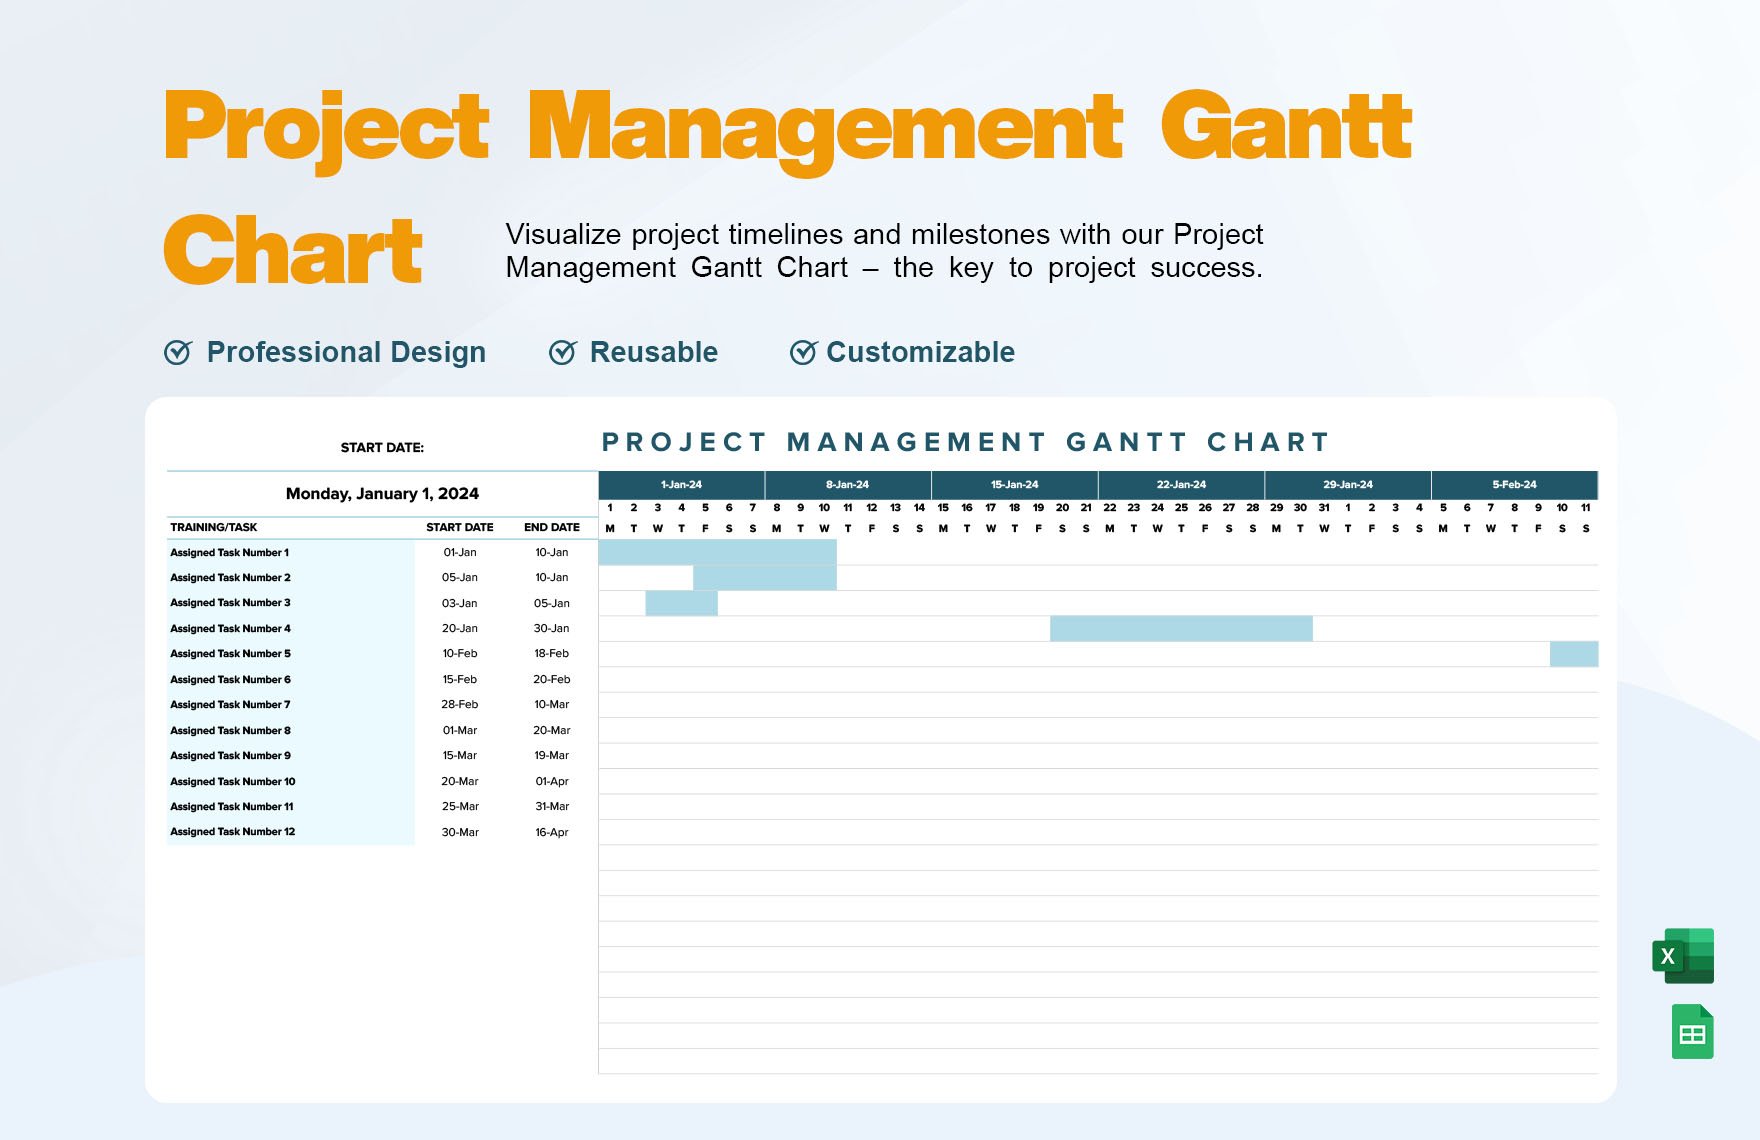
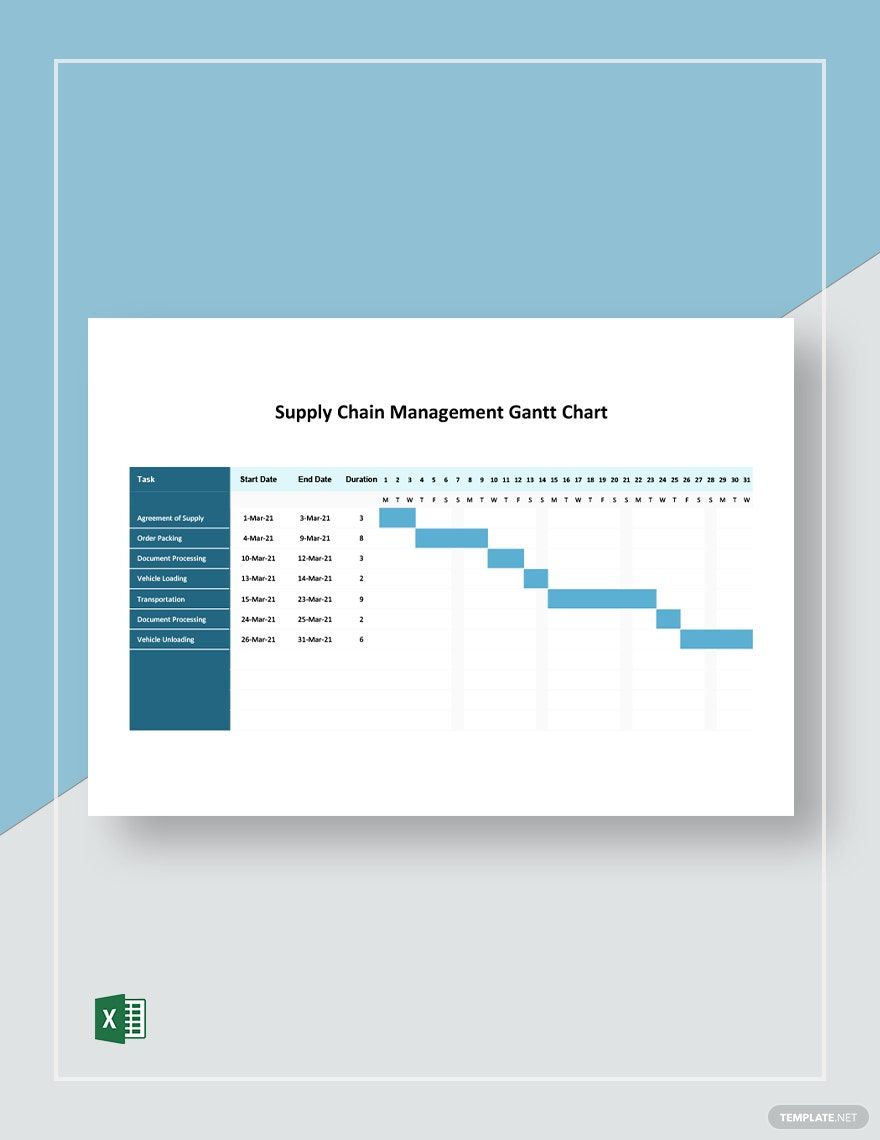
Once you're done with the chart framework that suits you, you can start adding the details. On the left of the chart, place the list of tasks with the top ones being the first or most important. For the dates, place them on the upper part of your Gantt chart.
5. Enhance the Look of Your Gantt Chart
Just because your project Gantt chart is for business or marketing purposes, it doesn't have to be boring or bland. Add minor enhancements to make your Gantt chart pleasing to look at. You can even add colors to the progress bars to distinguish the timelines for each task.


