Get Access to World’s largest Template Library & Tools

How To Make a Map in Microsoft Excel

Microsoft Excel‘s mapping capabilities allow users to transform geographical data into dynamic maps, offering a visual representation that can reveal trends, patterns, and insights not easily seen in traditional data formats. Whether you’re analyzing sales distributions, demographic information, or location-specific data, creating a map within Excel can enhance your ability to communicate complex information simply.
How To Make a Map in Microsoft Excel


Creating a map in Microsoft Excel is a straightforward way to visually represent your geographical data, providing clear insights and enhancing data presentations. This guide will introduce you to the steps necessary to bring your data to life through mapping.

  • Step 1. Prepare Your Data

    Ensure your geographical data is organized in a clear and structured format, with each piece of data (such as country, state, city, or postal code) in separate columns. Include relevant data you want to map, like sales figures or population, in adjacent columns.

  • Step 2. Insert a Map Chart

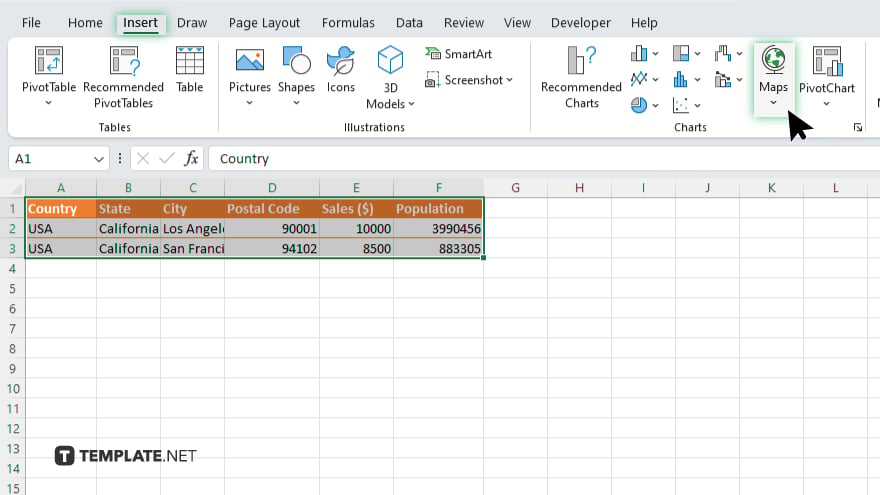
    step 2 insert a map chart

    Select your data range, including the geographical locations and the values you wish to visualize. Then, navigate to the “Insert” tab on the Excel ribbon, click on “Charts,” and select “Map.” If your data is recognized as geographical, Excel will automatically suggest a map chart.

  • Step 3. Customize Your Map

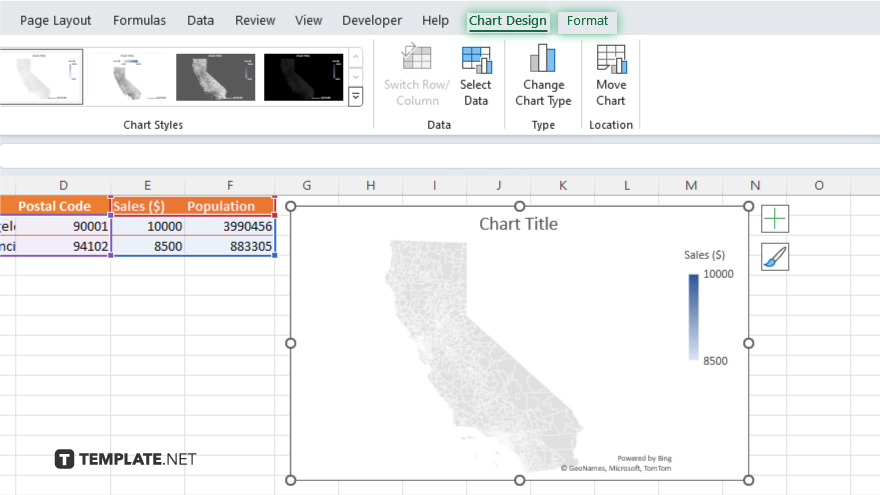
    step 3 customize your map

    Once your map is created, use the “Chart Design” and “Format” options to customize its appearance. You can adjust the color scheme, add chart elements like titles or labels, and modify the map projection or theme to better suit your presentation needs.

  • Step 4. Analyze and Interpret

    With your map created and customized, you can now analyze the geographical distribution of your data. Look for patterns, trends, or outliers that the visual representation makes apparent, and consider how these insights can inform your decisions or be communicated to your audience.

  • Step 5. Save and Share Your Map

    Finally, save your Excel workbook with the map. If you need to share your insights, you can export the map as an image or include it in reports or presentations to convey your findings effectively.

You may also find valuable insights in the following articles offering tips for Microsoft Excel:

note iconNote

Unlock Your Productivity with Over 100,000 Microsoft Excel Templates! Exclusively Available at Template.net – Download Now and Transform Your Data Handling Experience!

FAQs

What types of data can I visualize with a map in Excel?

You can visualize any geographical data, such as countries, regions, states, counties, or postal codes, along with associated numeric values like sales, population, or percentages.

Why can’t I find the map chart option in my Excel?

The map chart feature is available in Excel 2016 and later versions; ensure your Excel version supports this feature or updates to a newer version.

Can I customize the colors on my Excel map to represent different values?

Yes, you can customize the color scheme of your map in Excel to differentiate values by selecting the map and using the “Chart Design” or “Format” options.

How do I add labels to my map in Excel?

To add labels, click on the map to select it, then choose “Chart Elements” (the plus sign) and check the “Data Labels” option to display your data labels on the map.

Is it possible to create a world map that focuses on a specific region in Excel?

While Excel’s map charts automatically adjust to include all geographical data provided, zooming into a specific area isn’t directly supported, but you can manually adjust the focus by limiting the geographical data to your region of interest.

More in Excel

How to Insert a Comment in Microsoft ExcelHow to Find Merged Cells in Microsoft Excel
How to Unshare a Microsoft Excel FileHow to Export a PDF to Microsoft Excel
How to Calculate Z-Score in Microsoft ExcelHow to Remove Comments in Microsoft Excel
How to Do Covariance in Microsoft ExcelHow to Use a Data Table in Microsoft Excel
How to Use the Rank Function in Microsoft ExcelHow to Sum on Microsoft Excel
How to Unlock Scroll Lock in Microsoft ExcelHow to Open VBA in Microsoft Excel
How to Do Strikethrough on Microsoft ExcelHow to Repair a Corrupted Microsoft Excel File
How to Add a Bullet Point in Microsoft ExcelHow to Create Drop Downs in Microsoft Excel
How to Change the Background Color in Microsoft ExcelHow To Calculate Percentage Increase or Decrease in Excel
How to Refresh Formulas in Microsoft ExcelHow to Insert a Graph in Microsoft Excel
How to Allow Multiple Users to Edit Microsoft ExcelHow to Create a Scenario in Microsoft Excel
How to Combine Two Graphs in Microsoft ExcelHow to Search on Microsoft Excel Sheets
How to Strike Out in Microsoft ExcelHow to Make a Copy of a Sheet in Microsoft Excel
How to Delete a Line in Microsoft ExcelHow to Make a Comparison Chart in Microsoft Excel
How to Change Axis Titles in Microsoft ExcelHow to Center Across Selection in Microsoft Excel
How to Clear the Clipboard in Microsoft ExcelHow to Switch Rows to Columns in Microsoft Excel
How to Do Absolute Value in Microsoft ExcelHow to Save in Microsoft Excel
How to Merge in Microsoft ExcelHow to Do a Correlation in Microsoft Excel
How to Use Sum in Microsoft ExcelHow to Keep a Cell Constant in Microsoft Excel
How to Save a Microsoft Excel File as CSVHow to Add a Leading Zero in Microsoft Excel
How to Use the Round Function in Microsoft ExcelHow to Do Regression in Microsoft Excel
How to Divide on Microsoft ExcelHow to Calculate Age in Excel DD/MM/YYYY
How to Add a Calendar Drop Down in Microsoft ExcelHow to Use a Drop Down List in Microsoft Excel
How to Remove Blank Spaces in Microsoft ExcelHow to Print Grid Lines in Microsoft Excel
How to Insert a Line Break in Microsoft ExcelHow To Create a Percentage Formula in Microsoft Excel
How to Add Two Cells in Microsoft ExcelHow to Make a Line Chart in Microsoft Excel
How to Add Data to a Chart in Microsoft ExcelHow to Select Rows in Microsoft Excel
How to Make Alternating Colors in Microsoft ExcelHow to Return Within a Cell in Microsoft Excel
How to Remove Part of Text in an Excel CellHow to Add Strikethrough in Microsoft Excel
How to Add Drop Downs in Microsoft ExcelHow to Extract the Month from a Date in Microsoft Excel
How to Add a Zero in Front of a Number in Microsoft ExcelHow to Change Cell Color in Microsoft Excel
How to Add a Row in Microsoft Excel Using a ShortcutHow to Find R^2 in Microsoft Excel
How to Move to the Next Line in Microsoft ExcelHow to Calculate ROI in Microsoft Excel
How to Add a Tab in Microsoft ExcelHow to Create Lines in Microsoft Excel
How to Rotate Cells in Microsoft ExcelHow to Type Vertically in Microsoft Excel
How to Insert a Comma in Microsoft ExcelHow to Change Page Orientation in Microsoft Excel
How to Turn Off Read Only in Microsoft ExcelHow to Change to All Caps in Microsoft Excel
How to Download a Microsoft Excel FileHow to Share a Microsoft Excel File
How to Multiply 2 Columns in Microsoft ExcelHow to Get Rid of Empty Rows in Microsoft Excel
How to Find in Microsoft ExcelHow to Calculate Future Value in Microsoft Excel
How to Share a Microsoft Excel File with Multiple UsersHow to Make a Flow Chart in Microsoft Excel
How to Use If Then in Microsoft ExcelHow to Insert Numbers in Microsoft Excel
How to Draw a Line Through Text in Microsoft ExcelHow to Create a Forecast Sheet in Microsoft Excel
How to Resize Cells in Microsoft ExcelHow to Lock a Microsoft Excel File
How to AutoSum in Microsoft ExcelHow to Take Off Read Only in Microsoft Excel
How to Share Excel Files for Multiple Users Office 365How to Create Charts in Microsoft Excel
How to Start a New Line in Microsoft ExcelHow To Make a Map in Microsoft Excel
How to Remove a Table Microsoft ExcelHow to Join Cells in Microsoft Excel
How to Create a Microsoft Excel TemplateHow to Change the Date in Microsoft Excel
How to Turn Off Protected View in Microsoft ExcelHow to Add Numbers in a Microsoft Excel Column
bottom banner