Get Access to World’s largest Template Library & Tools

How to Run a Correlation in Microsoft Excel

Microsoft Excel offers powerful statistical tools, including the ability to run correlation analyses, which is essential for examining relationships between numerical variables. Understanding how to perform a correlation analysis is crucial for drawing meaningful conclusions from your data.
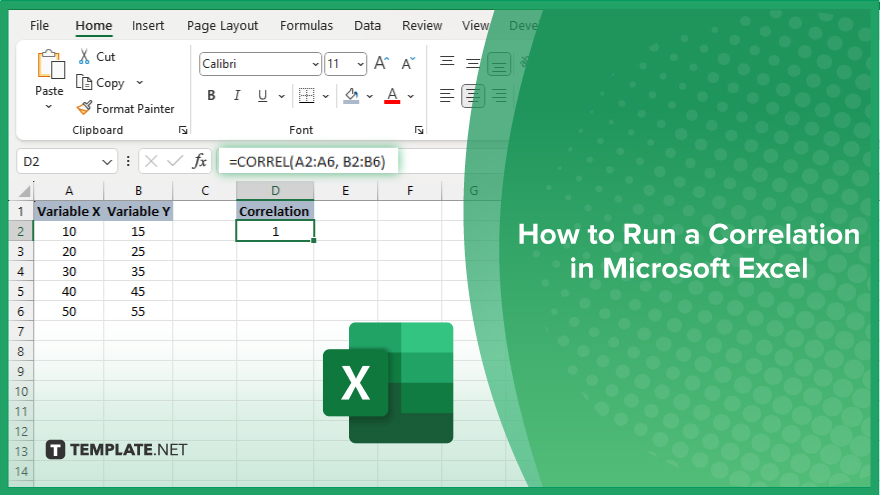
How to Run a Correlation in Microsoft Excel


In Microsoft Excel, calculating a correlation is a straightforward method to assess the strength and direction of a relationship between two data sets. Follow these simple steps to perform a correlation analysis effectively:

  • Step 1. Prepare Your Data

    Start by organizing your data in two adjacent columns on a single Excel worksheet. Label the top of each column to identify the variables you are comparing clearly. This setup facilitates easier input and interpretation of your correlation results.

  • Step 2. Enter the Correlation Formula

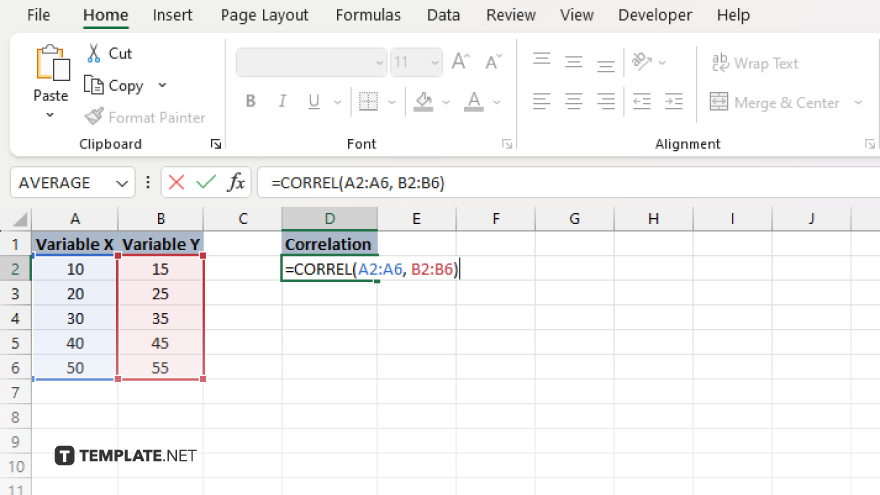
    step 2 enter the correlation formula

    Click on a blank cell where you want the correlation result to appear. Enter the correlation formula: “=CORREL(array1, array2).” Here, “array1” and “array2” represent the ranges of the data sets you are analyzing.

  • Step 3. Select Your Data Ranges

    After typing the formula, select the first data range for “array1” by clicking and dragging from the start to the end of your first data set. Repeat this for “array2” with your second data set. Ensure both ranges are of the same length to avoid errors.

  • Step 4. Execute the Formula

    Press the “Enter” key after selecting your data ranges. Excel will calculate the correlation coefficient and display it in the cell you selected in Step 2. This coefficient ranges from -1 to 1, where “-1” indicates a perfect negative correlation, “0” means no correlation, and “1” indicates a perfect positive correlation.

  • Step 5. Interpret the Results

    Evaluate the correlation coefficient to understand the relationship between your data sets. A positive value suggests that as one variable increases, the other tends to increase as well, whereas a negative value indicates that one variable increases as the other decreases. Use this insight to guide further analysis or decision-making processes.

You may also find valuable insights in the following articles offering tips for Microsoft Excel:

note iconNote

Unlock Your Productivity with Over 100,000 Microsoft Excel Templates! Exclusively Available at Template.net – Download Now and Transform Your Data Handling Experience!

FAQs

What does a correlation coefficient indicate in Excel?

The correlation coefficient measures the strength and direction of a linear relationship between two data sets.

Can Excel calculate correlation for more than two variables at once?

Excel can only calculate pairwise correlations between two variables at a time using the CORREL function.

Is it necessary for the data sets to be the same size when calculating correlation in Excel?

Yes, both data sets must have the same number of data points to calculate a correlation correctly.

What does a correlation coefficient of zero mean?

A correlation coefficient of zero indicates no linear relationship between the two variables.

How can I interpret a negative correlation coefficient?

A negative correlation coefficient means that as one variable increases, the other variable tends to decrease.

More in Excel

How to Insert a Comment in Microsoft ExcelHow to Find Merged Cells in Microsoft Excel
How to Unshare a Microsoft Excel FileHow to Export a PDF to Microsoft Excel
How to Calculate Z-Score in Microsoft ExcelHow to Remove Comments in Microsoft Excel
How to Do Covariance in Microsoft ExcelHow to Use a Data Table in Microsoft Excel
How to Use the Rank Function in Microsoft ExcelHow to Sum on Microsoft Excel
How to Unlock Scroll Lock in Microsoft ExcelHow to Open VBA in Microsoft Excel
How to Do Strikethrough on Microsoft ExcelHow to Repair a Corrupted Microsoft Excel File
How to Add a Bullet Point in Microsoft ExcelHow to Create Drop Downs in Microsoft Excel
How to Change the Background Color in Microsoft ExcelHow To Calculate Percentage Increase or Decrease in Excel
How to Refresh Formulas in Microsoft ExcelHow to Insert a Graph in Microsoft Excel
How to Allow Multiple Users to Edit Microsoft ExcelHow to Create a Scenario in Microsoft Excel
How to Combine Two Graphs in Microsoft ExcelHow to Search on Microsoft Excel Sheets
How to Strike Out in Microsoft ExcelHow to Make a Copy of a Sheet in Microsoft Excel
How to Delete a Line in Microsoft ExcelHow to Make a Comparison Chart in Microsoft Excel
How to Change Axis Titles in Microsoft ExcelHow to Center Across Selection in Microsoft Excel
How to Clear the Clipboard in Microsoft ExcelHow to Switch Rows to Columns in Microsoft Excel
How to Do Absolute Value in Microsoft ExcelHow to Save in Microsoft Excel
How to Merge in Microsoft ExcelHow to Do a Correlation in Microsoft Excel
How to Use Sum in Microsoft ExcelHow to Keep a Cell Constant in Microsoft Excel
How to Save a Microsoft Excel File as CSVHow to Add a Leading Zero in Microsoft Excel
How to Use the Round Function in Microsoft ExcelHow to Do Regression in Microsoft Excel
How to Divide on Microsoft ExcelHow to Calculate Age in Excel DD/MM/YYYY
How to Add a Calendar Drop Down in Microsoft ExcelHow to Use a Drop Down List in Microsoft Excel
How to Remove Blank Spaces in Microsoft ExcelHow to Print Grid Lines in Microsoft Excel
How to Insert a Line Break in Microsoft ExcelHow To Create a Percentage Formula in Microsoft Excel
How to Add Two Cells in Microsoft ExcelHow to Make a Line Chart in Microsoft Excel
How to Add Data to a Chart in Microsoft ExcelHow to Select Rows in Microsoft Excel
How to Make Alternating Colors in Microsoft ExcelHow to Return Within a Cell in Microsoft Excel
How to Remove Part of Text in an Excel CellHow to Add Strikethrough in Microsoft Excel
How to Add Drop Downs in Microsoft ExcelHow to Extract the Month from a Date in Microsoft Excel
How to Add a Zero in Front of a Number in Microsoft ExcelHow to Change Cell Color in Microsoft Excel
How to Add a Row in Microsoft Excel Using a ShortcutHow to Find R^2 in Microsoft Excel
How to Move to the Next Line in Microsoft ExcelHow to Calculate ROI in Microsoft Excel
How to Add a Tab in Microsoft ExcelHow to Create Lines in Microsoft Excel
How to Rotate Cells in Microsoft ExcelHow to Type Vertically in Microsoft Excel
How to Insert a Comma in Microsoft ExcelHow to Change Page Orientation in Microsoft Excel
How to Turn Off Read Only in Microsoft ExcelHow to Change to All Caps in Microsoft Excel
How to Download a Microsoft Excel FileHow to Share a Microsoft Excel File
How to Multiply 2 Columns in Microsoft ExcelHow to Get Rid of Empty Rows in Microsoft Excel
How to Find in Microsoft ExcelHow to Calculate Future Value in Microsoft Excel
How to Share a Microsoft Excel File with Multiple UsersHow to Make a Flow Chart in Microsoft Excel
How to Use If Then in Microsoft ExcelHow to Insert Numbers in Microsoft Excel
How to Draw a Line Through Text in Microsoft ExcelHow to Create a Forecast Sheet in Microsoft Excel
How to Resize Cells in Microsoft ExcelHow to Lock a Microsoft Excel File
How to AutoSum in Microsoft ExcelHow to Take Off Read Only in Microsoft Excel
How to Share Excel Files for Multiple Users Office 365How to Create Charts in Microsoft Excel
How to Start a New Line in Microsoft ExcelHow To Make a Map in Microsoft Excel
How to Remove a Table Microsoft ExcelHow to Join Cells in Microsoft Excel
How to Create a Microsoft Excel TemplateHow to Change the Date in Microsoft Excel
How to Turn Off Protected View in Microsoft ExcelHow to Add Numbers in a Microsoft Excel Column
bottom banner