


How to Make Table in Adobe Illustrator
Tables are important for making comparisons, compositions, or developing a comprehensive relationship analysis where a few variables and data points are available. These visual representation tools are used by many businesses and organizations to visualize data and other crucial information. In this article, learn how to easily create a table for your presentation or project in Adobe Illustrator.

How to Make a Table in Adobe Illustrator
Some examples of tables, charts, or graphs are bar charts, line graphs, area charts, histogram charts, scatter plot charts, and bubble charts. Below are simple steps that you can follow if you need a simple table in Adobe Illustrator.
-
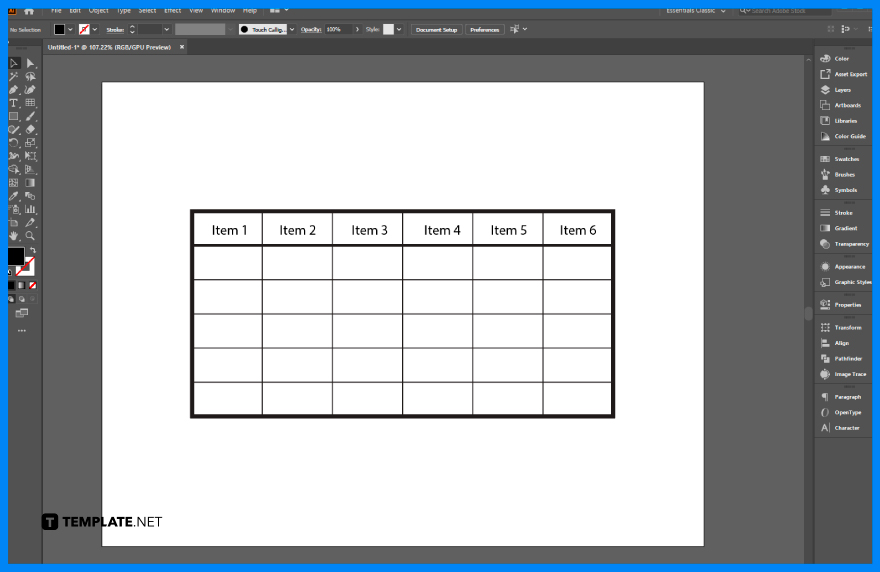
Step 1: Use the Rectangular Grid Tool

Open a new document in Illustrator. Go to the Toolset, select the Line Segment Tool, choose the Rectangular Grid Tool, and in the Rectangular Grid Tool Options, adjust the default width and height size, as well as the number of horizontal dividers and number of vertical dividers. -
Step 2: Adjust the Stroke Thickness

After you constructed the table, go to the Stroke panel. You may adjust the thickness of the stroke or the lines of the table. -
Step 3: Add the Text

Use the Type Tool to add the text to the table chart. Use other tools in the program to adjust the position and size of the text.
FAQs
Can you create a table in Adobe Illustrator?
Yes, you can create a table in Adobe Illustrator using the Rectangle tool and split it into cells according to your needs and preferences.
How to make an editable table in Illustrator?
Select Text, choose Table > Select > Table, move the pointer over the top left corner of the table so that the pointer turns into an arrow shape, and then click to select the entire table.
How to create an Excel table in Illustrator?
Open Adobe Illustrator, click the File menu, select Open, search the Excel table saved in PDF format, and open the file in Illustrator.
How to create a graph in Illustrator?
Use the Graph Tool, click your Artboard, drag it and form the size of the graph.
More in Adobe

